
Page 48 - Gas Adsorption Equilibria
P. 48
34 Chapter 1
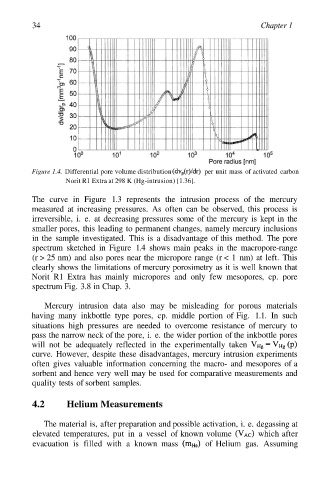
Figure 1.4. Differential pore volume distribution per unit mass of activated carbon
Norit R1 Extra at 298 K (Hg-intrusion) [1.36].
The curve in Figure 1.3 represents the intrusion process of the mercury
measured at increasing pressures. As often can be observed, this process is
irreversible, i. e. at decreasing pressures some of the mercury is kept in the
smaller pores, this leading to permanent changes, namely mercury inclusions
in the sample investigated. This is a disadvantage of this method. The pore
spectrum sketched in Figure 1.4 shows main peaks in the macropore-range
(r > 25 nm) and also pores near the micropore range (r < 1 nm) at left. This
clearly shows the limitations of mercury porosimetry as it is well known that
Norit R1 Extra has mainly micropores and only few mesopores, cp. pore
spectrum Fig. 3.8 in Chap. 3.
Mercury intrusion data also may be misleading for porous materials
having many inkbottle type pores, cp. middle portion of Fig. 1.1. In such
situations high pressures are needed to overcome resistance of mercury to
pass the narrow neck of the pore, i. e. the wider portion of the inkbottle pores
will not be adequately reflected in the experimentally taken
curve. However, despite these disadvantages, mercury intrusion experiments
often gives valuable information concerning the macro- and mesopores of a
sorbent and hence very well may be used for comparative measurements and
quality tests of sorbent samples.
4.2 Helium Measurements
The material is, after preparation and possible activation, i. e. degassing at
elevated temperatures, put in a vessel of known volume which after
evacuation is filled with a known mass of Helium gas. Assuming