
Page 177 - gas transport in porous media
P. 177
Chapter 9: Unstable Gas Flow in Fractures
171
the sample. Gas pressure was increased stepwise and the gas fingers grew (although
not with each pressure increase), until a single continuous flow path was established
through the sample from inlet to outlet, generally following a path of maximum
aperture. If the map of apertures were interpreted as a topographic contour map, the
initial gas flow path would be like walking along a ridge line. In some experiments
more than one gas flow path was established.
In experiments where gas was injected at a controlled flow rate, when the gas:liquid
volumetric flow-rate ratio was less than about 20:1, flow was not always stable, result-
ingindiscontinuousandcyclinggasflowasdescribedbelow. Pressureswereaveraged
overmanycyclestocalculatecapillarypressureandrelativepermeabilityvalues. Then
the gas flow rate was increased stepwise while liquid flow rate was decreased step-
wise. In this manner relative permeabilities to both phases were measured through
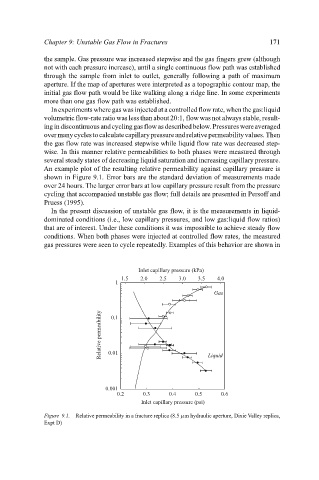
several steady states of decreasing liquid saturation and increasing capillary pressure.
An example plot of the resulting relative permeability against capillary pressure is
shown in Figure 9.1. Error bars are the standard deviation of measurements made
over 24 hours. The larger error bars at low capillary pressure result from the pressure
cycling that accompanied unstable gas flow; full details are presented in Persoff and
Pruess (1995).
In the present discussion of unstable gas flow, it is the measurements in liquid-
dominated conditions (i.e., low capillary pressures, and low gas:liquid flow ratios)
that are of interest. Under these conditions it was impossible to achieve steady flow
conditions. When both phases were injected at controlled flow rates, the measured
gas pressures were seen to cycle repeatedly. Examples of this behavior are shown in
Inlet capillary pressure (kPa)
1.5 2.0 2.5 3.0 3.5 4.0
1
Gas
Relative permeability 0.01 Liquid
0.1
0.001
0.2 0.3 0.4 0.5 0.6
Inlet capillary pressure (psi)
Figure 9.1. Relative permeability in a fracture replica (8.5 µm hydraulic aperture, Dixie Valley replica,
Expt D)