
Page 179 - gas transport in porous media
P. 179
Chapter 9: Unstable Gas Flow in Fractures
32
upper path 220 173
lower path 180
Pressure (psia) Gas inlet Pressure (kPa)
26
Liquid inlet
20
Gas outlet 140
Liquid outlet
14 100
348.9 349.8 350.7 351.6
Time (hr)
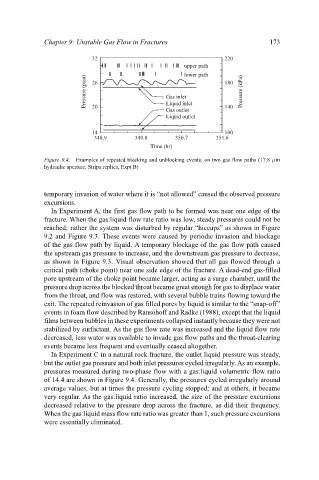
Figure 9.4. Examples of repeated blocking and unblocking events, on two gas flow paths (17.8 µm
hydraulic aperture, Stripa replica, Expt B)
temporary invasion of water where it is “not allowed” caused the observed pressure
excursions.
In Experiment A, the first gas flow path to be formed was near one edge of the
fracture. When the gas:liquid flow rate ratio was low, steady pressures could not be
reached; rather the system was disturbed by regular “hiccups” as shown in Figure
9.2 and Figure 9.3. These events were caused by periodic invasion and blockage
of the gas flow path by liquid. A temporary blockage of the gas flow path caused
the upstream gas pressure to increase, and the downstream gas pressure to decrease,
as shown in Figure 9.3. Visual observation showed that all gas flowed through a
critical path (choke point) near one side edge of the fracture. A dead-end gas-filled
pore upstream of the choke point became larger, acting as a surge chamber, until the
pressure drop across the blocked throat became great enough for gas to displace water
from the throat, and flow was restored, with several bubble trains flowing toward the
exit. The repeated reinvasion of gas filled pores by liquid is similar to the “snap-off”
events in foam flow described by Ransohoff and Radke (1988), except that the liquid
films between bubbles in these experiments collapsed instantly because they were not
stabilized by surfactant. As the gas flow rate was increased and the liquid flow rate
decreased, less water was available to invade gas flow paths and the throat-clearing
events became less frequent and eventually ceased altogether.
In Experiment C in a natural rock fracture, the outlet liquid pressure was steady,
but the outlet gas pressure and both inlet pressures cycled irregularly. As an example,
pressures measured during two-phase flow with a gas:liquid volumetric flow ratio
of 14.4 are shown in Figure 9.4. Generally, the pressures cycled irregularly around
average values, but at times the pressure cycling stopped; and at others, it became
very regular. As the gas:liquid ratio increased, the size of the pressure excursions
decreased relative to the pressure drop across the fracture, as did their frequency.
When the gas:liquid mass flow rate ratio was greater than 1, such pressure excursions
were essentially eliminated.