Page 323 - gas transport in porous media
P. 323

322
                                         1400
                                         1200                                            Tartre
                                     Concentrations  (in ppm)  1000
                                         800
                                         600
                                         400                  Purge is
                                                              stopped
                                         200
                                          0
                                            0    1    2    3    0    1    2    3
                                                            Time (in minutes)
                                           1400
                                           1200
                                           1000
                                        Concentrations  (in ppm)  800

                                           600
                                           400                Purge is
                                                              stopped
                                           200
                                             0
                                              0  1  2  3  4  5  6  7  0  1  2  3  4  5  6  7
                                                            Time (in minutes)
                                         1400
                                         1200
                                         1000
                                      Concentrations  (in ppm)  800  Purge is

                                                              stopped
                                          600
                                          400
                                          200
                                           0
                                             0    1    2    3   0    1    2    3
                                                         Time (in minutes)

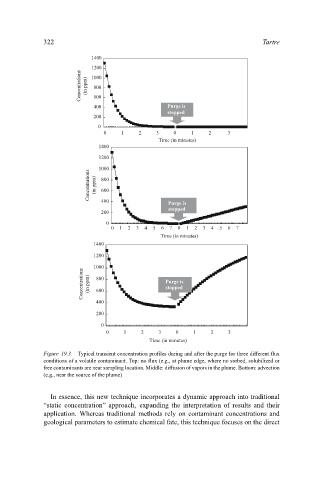
                           Figure 19.3. Typical transient concentration profiles during and after the purge for three different flux
                           conditions of a volatile contaminant. Top: no flux (e.g., at plume edge, where no sorbed, solubilized or
                           free contaminants are near sampling location. Middle: diffusion of vapors in the plume. Bottom: advection
                           (e.g., near the source of the plume)


                             In essence, this new technique incorporates a dynamic approach into traditional
                           “static concentration” approach, expanding the interpretation of results and their
                           application. Whereas traditional methods rely on contaminant concentrations and
                           geological parameters to estimate chemical fate, this technique focuses on the direct
   318   319   320   321   322   323   324   325   326   327   328