
Page 66 - gas transport in porous media
P. 66
Chapter 5: Two-Phase Gas Transport
10
10 10 9 59
10 8 7 van Genuchten
Capillary pressure (Pa) 10 6 5 m = 0.3; n=1.43
S ,r = 0.2
4
1/α =10 Pa
10
10
10 4
10 3
10 2
0.00 0.20 0.40 0.60 0.80 1.00
Liquid saturation
(a)
1.00 1.00
0.90 0.90
Luckner etal.
Liquid-phase relative permeability 0.60 van Genuchten–Mualem Gas-phase relative permeability 0.60
0.80
0.80
Parker et al.
0.70
0.70
= 0.2
S
,r
m = 0.3; n = 1.43
0.50
0.50
0.40
0.40
0.30
0.30
=0.2
S
,r
0.20
m=0.3; n =1.43
0.10
0.10 0.20 van Genuchten
0.00 0.00
0.00 0.20 0.40 0.60 0.80 1.00 0.00 0.20 0.40 0.60 0.80 1.00
Liquid saturation Liquid saturation
(b) (c)
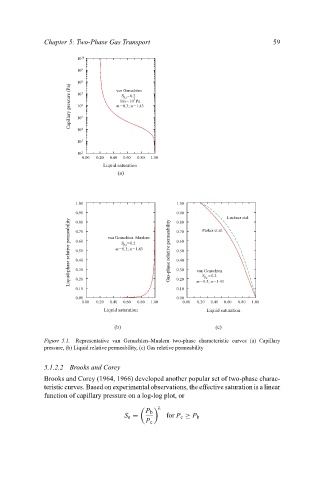
Figure 5.1. Representative van Genuchten–Mualem two-phase characteristic curves (a) Capillary
pressure, (b) Liquid relative permeability, (c) Gas relative permeability
5.1.2.2 Brooks and Corey
Brooks and Corey (1964, 1966) developed another popular set of two-phase charac-
teristic curves. Based on experimental observations, the effective saturation is a linear
function of capillary pressure on a log-log plot, or
λ
P b
S e = for P c ≥ P b
P c