
Page 69 - gas transport in porous media
P. 69
62
10
9
10 10 Webb
10 8 7 Brooks and Corey
Capillary pressure (Pa) 10 6 5 P =10 Pa
S
= 0.2
,r
4
b
10
l = 0.43
10
10 4
10 3
10 2
0.00 0.20 0.40 0.60 0.80 1.00
Liquid saturation
(a)
1.00 1.00
0.90 0.90
Liquid-phase relative permeability 0.60 Brooks and Corey Gas-phase relative permeability 0.60 Brooks and Corey
0.80
0.80
0.70
0.70
S
= 0.2
,r
l = 0.43
0.50
0.50
0.40
0.40
0.30
0.30
= 0.2
S
,r
0.20
0.10 0.20 λ = 0.43
0.10
0.00 0.00
0.00 0.20 0.40 0.60 0.80 1.00 0.00 0.20 0.40 0.60 0.80 1.00
Liquid saturation Liquid saturation
(b) (c)
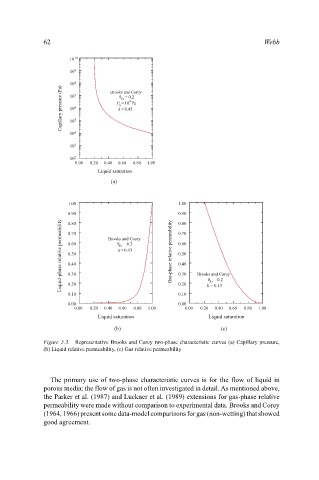
Figure 5.3. Representative Brooks and Corey two-phase characteristic curves (a) Capillary pressure,
(b) Liquid relative permeability, (c) Gas relative permeability
The primary use of two-phase characteristic curves is for the flow of liquid in
porous media; the flow of gas is not often investigated in detail. As mentioned above,
the Parker et al. (1987) and Luckner et al. (1989) extensions for gas-phase relative
permeability were made without comparison to experimental data. Brooks and Corey
(1964, 1966) present some data-model comparisons for gas (non-wetting) that showed
good agreement.