
Page 114 - Geochemical Anomaly and Mineral Prospectivity Mapping in GIS
P. 114
Fractal Analysis of Geochemical Anomalies 113
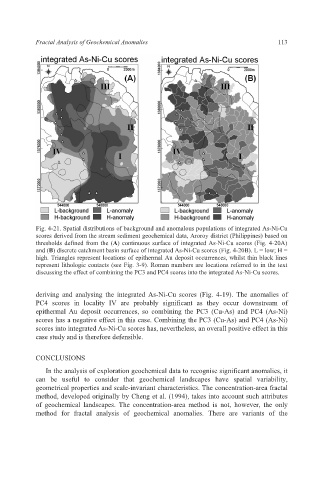
Fig. 4-21. Spatial distributions of background and anomalous populations of integrated As-Ni-Cu
scores derived from the stream sediment geochemical data, Aroroy district (Philippines) based on
thresholds defined from the (A) continuous surface of integrated As-Ni-Cu scores (Fig. 4-20A)
and (B) discrete catchment basin surface of integrated As-Ni-Cu scores (Fig. 4-20B). L = low; H =
high. Triangles represent locations of epithermal Au deposit occurrences, whilst thin black lines
represent lithologic contacts (see Fig. 3-9). Roman numbers are locations referred to in the text
discussing the effect of combining the PC3 and PC4 scores into the integrated As-Ni-Cu scores.
deriving and analysing the integrated As-Ni-Cu scores (Fig. 4-19). The anomalies of
PC4 scores in locality IV are probably significant as they occur downstream of
epithermal Au deposit occurrences, so combining the PC3 (Cu-As) and PC4 (As-Ni)
scores has a negative effect in this case. Combining the PC3 (Cu-As) and PC4 (As-Ni)
scores into integrated As-Ni-Cu scores has, nevertheless, an overall positive effect in this
case study and is therefore defensible.
CONCLUSIONS
In the analysis of exploration geochemical data to recognise significant anomalies, it
can be useful to consider that geochemical landscapes have spatial variability,
geometrical properties and scale-invariant characteristics. The concentration-area fractal
method, developed originally by Cheng et al. (1994), takes into account such attributes
of geochemical landscapes. The concentration-area method is not, however, the only
method for fractal analysis of geochemical anomalies. There are variants of the