
Page 119 - Geochemical Anomaly and Mineral Prospectivity Mapping in GIS
P. 119
118 Chapter 5
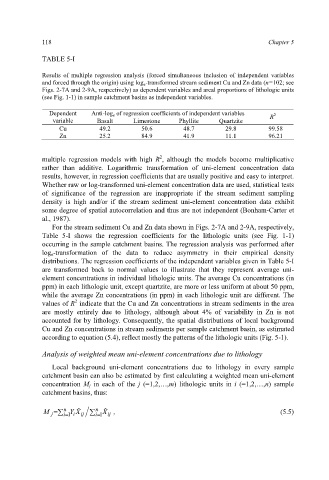
TABLE 5-I
Results of multiple regression analysis (forced simultaneous inclusion of independent variables
and forced through the origin) using log e -transformed stream sediment Cu and Zn data (n=102; see
Figs. 2-7A and 2-9A, respectively) as dependent variables and areal proportions of lithologic units
(see Fig. 1-1) in sample catchment basins as independent variables.
Dependent Anti-log e of regression coefficients of independent variables R
2
variable Basalt Limestone Phyllite Quartzite
Cu 49.2 50.6 48.7 29.8 99.58
Zn 25.2 84.9 41.9 11.1 96.21
2
multiple regression models with high R , although the models become multiplicative
rather than additive. Logarithmic transformation of uni-element concentration data
results, however, in regression coefficients that are usually positive and easy to interpret.
Whether raw or log-transformed uni-element concentration data are used, statistical tests
of significance of the regression are inappropriate if the stream sediment sampling
density is high and/or if the stream sediment uni-element concentration data exhibit
some degree of spatial autocorrelation and thus are not independent (Bonham-Carter et
al., 1987).
For the stream sediment Cu and Zn data shown in Figs. 2-7A and 2-9A, respectively,
Table 5-I shows the regression coefficients for the lithologic units (see Fig. 1-1)
occurring in the sample catchment basins. The regression analysis was performed after
log e-transformation of the data to reduce asymmetry in their empirical density
distributions. The regression coefficients of the independent variables given in Table 5-I
are transformed back to normal values to illustrate that they represent average uni-
element concentrations in individual lithologic units. The average Cu concentrations (in
ppm) in each lithologic unit, except quartzite, are more or less uniform at about 50 ppm,
while the average Zn concentrations (in ppm) in each lithologic unit are different. The
2
values of R indicate that the Cu and Zn concentrations in stream sediments in the area
are mostly entirely due to lithology, although about 4% of variability in Zn is not
accounted for by lithology. Consequently, the spatial distributions of local background
Cu and Zn concentrations in stream sediments per sample catchment basin, as estimated
according to equation (5.4), reflect mostly the patterns of the lithologic units (Fig. 5-1).
Analysis of weighted mean uni-element concentrations due to lithology
Local background uni-element concentrations due to lithology in every sample
catchment basin can also be estimated by first calculating a weighted mean uni-element
concentration M j in each of the j (=1,2,…,m) lithologic units in i (=1,2,…,n) sample
catchment basins, thus:
n
n
M j = ¦ = i 1 Y i X ˆ ij ¦ = i 1 X ˆ , (5.5)
ij