
Page 120 - Geochemical Anomaly and Mineral Prospectivity Mapping in GIS
P. 120
Catchment Basin Analysis of Stream Sediment Anomalies 119
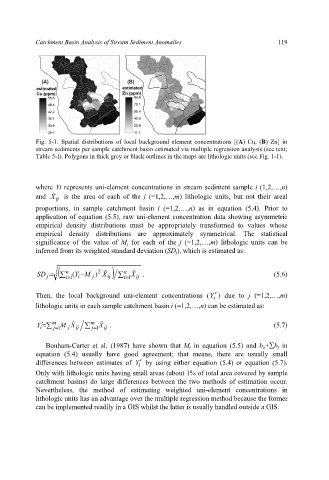
Fig. 5-1. Spatial distributions of local background element concentrations [(A) Cu, (B) Zn] in
stream sediments per sample catchment basin estimated via multiple regression analysis (see text;
Table 5-I). Polygons in thick grey or black outlines in the maps are lithologic units (see Fig. 1-1).
where Yi represents uni-element concentrations in stream sediment sample i (1,2,…,n)
and X ˆ is the area of each of the j (=1,2,…,m) lithologic units, but not their areal
ij
proportions, in sample catchment basin i (=1,2,…,n) as in equation (5.4). Prior to
application of equation (5.5), raw uni-element concentration data showing asymmetric
empirical density distributions must be appropriately transformed to values whose
empirical density distributions are approximately symmetrical. The statistical
significance of the value of M j for each of the j (=1,2,…,m) lithologic units can be
inferred from its weighted standard deviation (SD j), which is estimated as:
n
SD j = (¦ ( Y i −M ) 2 X ˆ ij ) ¦ n = i 1 X ˆ ij . (5.6)
j
= i 1
Then, the local background uni-element concentrations (Y ′ ) due to j (=1,2,…,m)
i
lithologic units in each sample catchment basin i (=1,2,…,n) can be estimated as:
= ′ Y m M X ˆ m X ˆ . (5.7)
i ¦ = j 1 j ij ¦ = j 1 ij
Bonham-Carter et al. (1987) have shown that M j in equation (5.5) and b o+¦b j in
equation (5.4) usually have good agreement; that means, there are usually small
differences between estimates of Y′ by using either equation (5.4) or equation (5.7).
i
Only with lithologic units having small areas (about 1% of total area covered by sample
catchment basins) do large differences between the two methods of estimation occur.
Nevertheless, the method of estimating weighted uni-element concentrations in
lithologic units has an advantage over the multiple regression method because the former
can be implemented readily in a GIS whilst the latter is usually handled outside a GIS.