
Page 123 - Geochemical Anomaly and Mineral Prospectivity Mapping in GIS
P. 123
122 Chapter 5
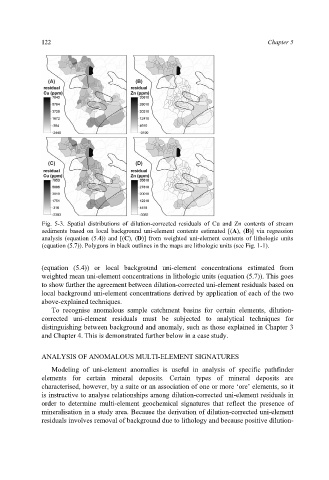
Fig. 5-3. Spatial distributions of dilution-corrected residuals of Cu and Zn contents of stream
sediments based on local background uni-element contents estimated [(A), (B)] via regression
analysis (equation (5.4)) and [(C), (D)] from weighted uni-element contents of lithologic units
(equation (5.7)). Polygons in black outlines in the maps are lithologic units (see Fig. 1-1).
(equation (5.4)) or local background uni-element concentrations estimated from
weighted mean uni-element concentrations in lithologic units (equation (5.7)). This goes
to show further the agreement between dilution-corrected uni-element residuals based on
local background uni-element concentrations derived by application of each of the two
above-explained techniques.
To recognise anomalous sample catchment basins for certain elements, dilution-
corrected uni-element residuals must be subjected to analytical techniques for
distinguishing between background and anomaly, such as those explained in Chapter 3
and Chapter 4. This is demonstrated further below in a case study.
ANALYSIS OF ANOMALOUS MULTI-ELEMENT SIGNATURES
Modeling of uni-element anomalies is useful in analysis of specific pathfinder
elements for certain mineral deposits. Certain types of mineral deposits are
characterised, however, by a suite or an association of one or more ‘ore’ elements, so it
is instructive to analyse relationships among dilution-corrected uni-element residuals in
order to determine multi-element geochemical signatures that reflect the presence of
mineralisation in a study area. Because the derivation of dilution-corrected uni-element
residuals involves removal of background due to lithology and because positive dilution-