
Page 121 - Geochemical Anomaly and Mineral Prospectivity Mapping in GIS
P. 121
120 Chapter 5
TABLE 5-II
Mean element concentrations (M j ) in individual lithologic units, in the area shown in Figs. 1-1 and
5-1, as estimated according to equation (5.5) (see text).
Estimated mean element concentrations (M j ; in ppm) in individual lithologic units
Element
Basalt Limestone Phyllite Quartzite
Cu 50.4 56.8 47.5 34.1
Zn 33.8 73.0 43.8 16.9
In our example data of Cu and Zn in stream sediment samples, the mean uni-element
concentrations (M j) in the individual lithologic units (Table 5-II) as estimated according
to equation (5.5) are more or less similar to the results of the multiple regression analysis
(Table 5-I), depending on the element examined. These results demonstrate good
agreement between b j in equation (5.4) and M j in equation (5.5). Consequently, the
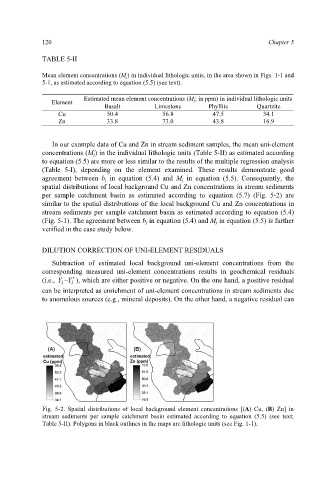
spatial distributions of local background Cu and Zn concentrations in stream sediments
per sample catchment basin as estimated according to equation (5.7) (Fig. 5-2) are
similar to the spatial distributions of the local background Cu and Zn concentrations in
stream sediments per sample catchment basin as estimated according to equation (5.4)
(Fig. 5-1). The agreement between b j in equation (5.4) and M j in equation (5.5) is further
verified in the case study below.
DILUTION CORRECTION OF UNI-ELEMENT RESIDUALS
Subtraction of estimated local background uni-element concentrations from the
corresponding measured uni-element concentrations results in geochemical residuals
(i.e., Y − Y ′ ), which are either positive or negative. On the one hand, a positive residual
i
i
can be interpreted as enrichment of uni-element concentrations in stream sediments due
to anomalous sources (e.g., mineral deposits). On the other hand, a negative residual can
Fig. 5-2. Spatial distributions of local background element concentrations [(A) Cu, (B) Zn] in
stream sediments per sample catchment basin estimated according to equation (5.5) (see text;
Table 5-II). Polygons in black outlines in the maps are lithologic units (see Fig. 1-1).