
Page 126 - Geochemical Anomaly and Mineral Prospectivity Mapping in GIS
P. 126
Catchment Basin Analysis of Stream Sediment Anomalies 125
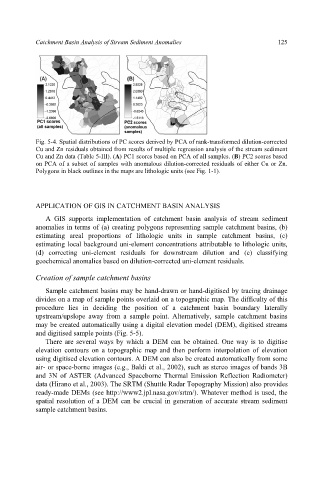
Fig. 5-4. Spatial distributions of PC scores derived by PCA of rank-transformed dilution-corrected
Cu and Zn residuals obtained from results of multiple regression analysis of the stream sediment
Cu and Zn data (Table 5-III). (A) PC1 scores based on PCA of all samples. (B) PC2 scores based
on PCA of a subset of samples with anomalous dilution-corrected residuals of either Cu or Zn.
Polygons in black outlines in the maps are lithologic units (see Fig. 1-1).
APPLICATION OF GIS IN CATCHMENT BASIN ANALYSIS
A GIS supports implementation of catchment basin analysis of stream sediment
anomalies in terms of (a) creating polygons representing sample catchment basins, (b)
estimating areal proportions of lithologic units in sample catchment basins, (c)
estimating local background uni-element concentrations attributable to lithologic units,
(d) correcting uni-element residuals for downstream dilution and (e) classifying
geochemical anomalies based on dilution-corrected uni-element residuals.
Creation of sample catchment basins
Sample catchment basins may be hand-drawn or hand-digitised by tracing drainage
divides on a map of sample points overlaid on a topographic map. The difficulty of this
procedure lies in deciding the position of a catchment basin boundary laterally
upstream/upslope away from a sample point. Alternatively, sample catchment basins
may be created automatically using a digital elevation model (DEM), digitised streams
and digitised sample points (Fig. 5-5).
There are several ways by which a DEM can be obtained. One way is to digitise
elevation contours on a topographic map and then perform interpolation of elevation
using digitised elevation contours. A DEM can also be created automatically from some
air- or space-borne images (e.g., Baldi et al., 2002), such as stereo images of bands 3B
and 3N of ASTER (Advanced Spaceborne Thermal Emission Reflection Radiometer)
data (Hirano et al., 2003). The SRTM (Shuttle Radar Topography Mission) also provides
ready-made DEMs (see http://www2.jpl.nasa.gov/srtm/). Whatever method is used, the
spatial resolution of a DEM can be crucial in generation of accurate stream sediment
sample catchment basins.