
Page 129 - Geochemical Anomaly and Mineral Prospectivity Mapping in GIS
P. 129
128 Chapter 5
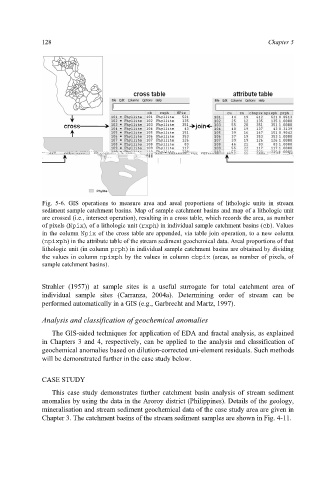
Fig. 5-6. GIS operations to measure area and areal proportions of lithologic units in stream
sediment sample catchment basins. Map of sample catchment basins and map of a lithologic unit
are crossed (i.e., intersect operation), resulting in a cross table, which records the area, as number
of pixels (Npix), of a lithologic unit (rxph) in individual sample catchment basins (cb). Values
in the column Npix of the cross table are appended, via table join operation, to a new column
(npixph) in the attribute table of the stream sediment geochemical data. Areal proportions of that
lithologic unit (in column prph) in individual sample catchment basins are obtained by dividing
the values in column npixph by the values in column cbpix (areas, as number of pixels, of
sample catchment basins).
Strahler (1957)) at sample sites is a useful surrogate for total catchment area of
individual sample sites (Carranza, 2004a). Determining order of stream can be
performed automatically in a GIS (e.g., Garbrecht and Martz, 1997).
Analysis and classification of geochemical anomalies
The GIS-aided techniques for application of EDA and fractal analysis, as explained
in Chapters 3 and 4, respectively, can be applied to the analysis and classification of
geochemical anomalies based on dilution-corrected uni-element residuals. Such methods
will be demonstrated further in the case study below.
CASE STUDY
This case study demonstrates further catchment basin analysis of stream sediment
anomalies by using the data in the Aroroy district (Philippines). Details of the geology,
mineralisation and stream sediment geochemical data of the case study area are given in
Chapter 3. The catchment basins of the stream sediment samples are shown in Fig. 4-11.