
Page 131 - Geochemical Anomaly and Mineral Prospectivity Mapping in GIS
P. 131
130 Chapter 5
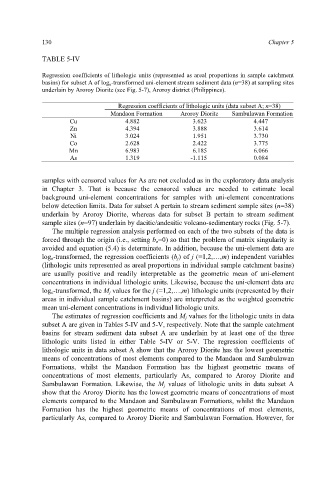
TABLE 5-IV
Regression coefficients of lithologic units (represented as areal proportions in sample catchment
basins) for subset A of log e -transformed uni-element stream sediment data (n=38) at sampling sites
underlain by Aroroy Diorite (see Fig. 5-7), Aroroy district (Philippines).
Regression coefficients of lithologic units (data subset A; n=38)
Mandaon Formation Aroroy Diorite Sambulawan Formation
Cu 4.882 3.623 4.447
Zn 4.394 3.888 3.614
Ni 3.024 1.951 3.730
Co 2.628 2.422 3.775
Mn 6.983 6.185 6.066
As 1.319 -1.115 0.084
samples with censored values for As are not excluded as in the exploratory data analysis
in Chapter 3. That is because the censored values are needed to estimate local
background uni-element concentrations for samples with uni-element concentrations
below detection limits. Data for subset A pertain to stream sediment sample sites (n=38)
underlain by Aroroy Diorite, whereas data for subset B pertain to stream sediment
sample sites (n=97) underlain by dacitic/andesitic volcano-sedimentary rocks (Fig. 5-7).
The multiple regression analysis performed on each of the two subsets of the data is
forced through the origin (i.e., setting b o=0) so that the problem of matrix singularity is
avoided and equation (5.4) is determinate. In addition, because the uni-element data are
log e-transformed, the regression coefficients (b j) of j (=1,2,…,m) independent variables
(lithologic units represented as areal proportions in individual sample catchment basins)
are usually positive and readily interpretable as the geometric mean of uni-element
concentrations in individual lithologic units. Likewise, because the uni-element data are
log e-transformed, the M j values for the j (=1,2,…,m) lithologic units (represented by their
areas in individual sample catchment basins) are interpreted as the weighted geometric
mean uni-element concentrations in individual lithologic units.
The estimates of regression coefficients and M j values for the lithologic units in data
subset A are given in Tables 5-IV and 5-V, respectively. Note that the sample catchment
basins for stream sediment data subset A are underlain by at least one of the three
lithologic units listed in either Table 5-IV or 5-V. The regression coefficients of
lithologic units in data subset A show that the Aroroy Diorite has the lowest geometric
means of concentrations of most elements compared to the Mandaon and Sambulawan
Formations, whilst the Mandaon Formation has the highest geometric means of
concentrations of most elements, particularly As, compared to Aroroy Diorite and
Sambulawan Formation. Likewise, the M j values of lithologic units in data subset A
show that the Aroroy Diorite has the lowest geometric means of concentrations of most
elements compared to the Mandaon and Sambulawan Formations, whilst the Mandaon
Formation has the highest geometric means of concentrations of most elements,
particularly As, compared to Aroroy Diorite and Sambulawan Formation. However, for