
Page 135 - Geochemical Anomaly and Mineral Prospectivity Mapping in GIS
P. 135
134 Chapter 5
TABLE 5-VIII
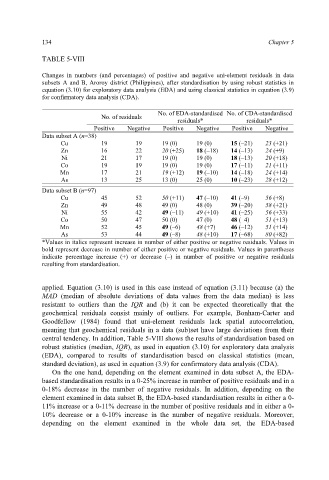
Changes in numbers (and percentages) of positive and negative uni-element residuals in data
subsets A and B, Aroroy district (Philippines), after standardisation by using robust statistics in
equation (3.10) for exploratory data analysis (EDA) and using classical statistics in equation (3.9)
for confirmatory data analysis (CDA).
No. of EDA-standardised No. of CDA-standardised
No. of residuals
residuals* residuals*
Positive Negative Positive Negative Positive Negative
Data subset A (n=38)
Cu 19 19 19 (0) 19 (0) 15 (–21) 23 (+21)
Zn 16 22 20 (+25) 18 (–18) 14 (–13) 24 (+9)
Ni 21 17 19 (0) 19 (0) 18 (–13) 20 (+18)
Co 19 19 19 (0) 19 (0) 17 (–11) 21 (+11)
Mn 17 21 19 (+12) 19 (–10) 14 (–18) 24 (+14)
As 13 25 13 (0) 25 (0) 10 (–23) 28 (+12)
Data subset B (n=97)
Cu 45 52 50 (+11) 47 (–10) 41 (–9) 56 (+8)
Zn 49 48 49 (0) 48 (0) 39 (–20) 58 (+21)
Ni 55 42 49 (–11) 49 (+10) 41 (–25) 56 (+33)
Co 50 47 50 (0) 47 (0) 48 (–4) 51 (+13)
Mn 52 45 49 (–6) 48 (+7) 46 (–12) 51 (+14)
As 53 44 49 (–8) 48 (+10) 17 (–68) 80 (+82)
*Values in italics represent increase in number of either positive or negative residuals. Values in
bold represent decrease in number of either positive or negative residuals. Values in parentheses
indicate percentage increase (+) or decrease (–) in number of positive or negative residuals
resulting from standardisation.
applied. Equation (3.10) is used in this case instead of equation (3.11) because (a) the
MAD (median of absolute deviations of data values from the data median) is less
resistant to outliers than the IQR and (b) it can be expected theoretically that the
geochemical residuals consist mainly of outliers. For example, Bonham-Carter and
Goodfellow (1984) found that uni-element residuals lack spatial autocorrelation,
meaning that geochemical residuals in a data (sub)set have large deviations from their
central tendency. In addition, Table 5-VIII shows the results of standardisation based on
robust statistics (median, IQR), as used in equation (3.10) for exploratory data analysis
(EDA), compared to results of standardisation based on classical statistics (mean,
standard deviation), as used in equation (3.9) for confirmatory data analysis (CDA).
On the one hand, depending on the element examined in data subset A, the EDA-
based standardisation results in a 0-25% increase in number of positive residuals and in a
0-18% decrease in the number of negative residuals. In addition, depending on the
element examined in data subset B, the EDA-based standardisation results in either a 0-
11% increase or a 0-11% decrease in the number of positive residuals and in either a 0-
10% decrease or a 0-10% increase in the number of negative residuals. Moreover,
depending on the element examined in the whole data set, the EDA-based