
Page 130 - Geochemical Anomaly and Mineral Prospectivity Mapping in GIS
P. 130
Catchment Basin Analysis of Stream Sediment Anomalies 129
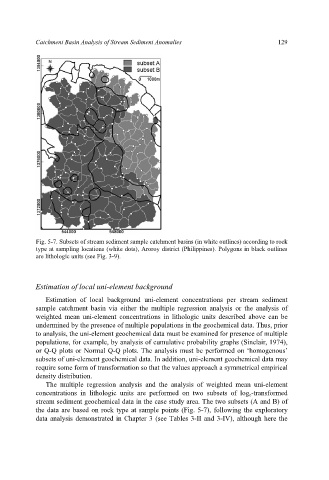
Fig. 5-7. Subsets of stream sediment sample catchment basins (in white outlines) according to rock
type at sampling locations (white dots), Aroroy district (Philippines). Polygons in black outlines
are lithologic units (see Fig. 3-9).
Estimation of local uni-element background
Estimation of local background uni-element concentrations per stream sediment
sample catchment basin via either the multiple regression analysis or the analysis of
weighted mean uni-element concentrations in lithologic units described above can be
undermined by the presence of multiple populations in the geochemical data. Thus, prior
to analysis, the uni-element geochemical data must be examined for presence of multiple
populations, for example, by analysis of cumulative probability graphs (Sinclair, 1974),
or Q-Q plots or Normal Q-Q plots. The analysis must be performed on ‘homogenous’
subsets of uni-element geochemical data. In addition, uni-element geochemical data may
require some form of transformation so that the values approach a symmetrical empirical
density distribution.
The multiple regression analysis and the analysis of weighted mean uni-element
concentrations in lithologic units are performed on two subsets of log e-transformed
stream sediment geochemical data in the case study area. The two subsets (A and B) of
the data are based on rock type at sample points (Fig. 5-7), following the exploratory
data analysis demonstrated in Chapter 3 (see Tables 3-II and 3-IV), although here the