
Page 132 - Geochemical Anomaly and Mineral Prospectivity Mapping in GIS
P. 132
Catchment Basin Analysis of Stream Sediment Anomalies 131
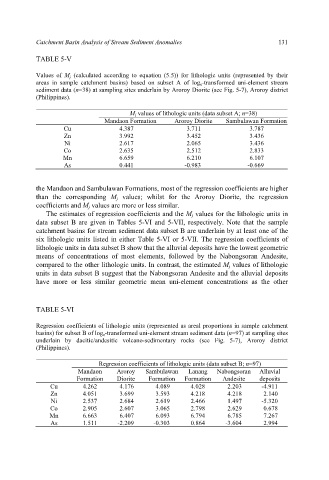
TABLE 5-V
Values of M j (calculated according to equation (5.5)) for lithologic units (represented by their
areas in sample catchment basins) based on subset A of log e -transformed uni-element stream
sediment data (n=38) at sampling sites underlain by Aroroy Diorite (see Fig. 5-7), Aroroy district
(Philippines).
M j values of lithologic units (data subset A; n=38)
Mandaon Formation Aroroy Diorite Sambulawan Formation
Cu 4.387 3.711 3.787
Zn 3.992 3.452 3.436
Ni 2.617 2.065 3.436
Co 2.635 2.512 2.833
Mn 6.659 6.210 6.107
As 0.441 -0.983 -0.669
the Mandaon and Sambulawan Formations, most of the regression coefficients are higher
than the corresponding M j values; whilst for the Aroroy Diorite, the regression
coefficients and M j values are more or less similar.
The estimates of regression coefficients and the M j values for the lithologic units in
data subset B are given in Tables 5-VI and 5-VII, respectively. Note that the sample
catchment basins for stream sediment data subset B are underlain by at least one of the
six lithologic units listed in either Table 5-VI or 5-VII. The regression coefficients of
lithologic units in data subset B show that the alluvial deposits have the lowest geometric
means of concentrations of most elements, followed by the Nabongsoran Andesite,
compared to the other lithologic units. In contrast, the estimated M j values of lithologic
units in data subset B suggest that the Nabongsoran Andesite and the alluvial deposits
have more or less similar geometric mean uni-element concentrations as the other
TABLE 5-VI
Regression coefficients of lithologic units (represented as areal proportions in sample catchment
basins) for subset B of log e -transformed uni-element stream sediment data (n=97) at sampling sites
underlain by dacitic/andesitic volcano-sedimentary rocks (see Fig. 5-7), Aroroy district
(Philippines).
Regression coefficients of lithologic units (data subset B; n=97)
Mandaon Aroroy Sambulawan Lanang Nabongsoran Alluvial
Formation Diorite Formation Formation Andesite deposits
Cu 4.262 4.176 4.089 4.028 2.203 -4.911
Zn 4.051 3.699 3.593 4.218 4.218 2.140
Ni 2.537 2.684 2.619 2.466 1.497 -5.320
Co 2.905 2.607 3.065 2.798 2.629 0.678
Mn 6.663 6.407 6.093 6.794 6.785 7.267
As 1.511 -2.209 -0.303 0.864 -3.604 2.994