
Page 136 - Geochemical Anomaly and Mineral Prospectivity Mapping in GIS
P. 136
Catchment Basin Analysis of Stream Sediment Anomalies 135
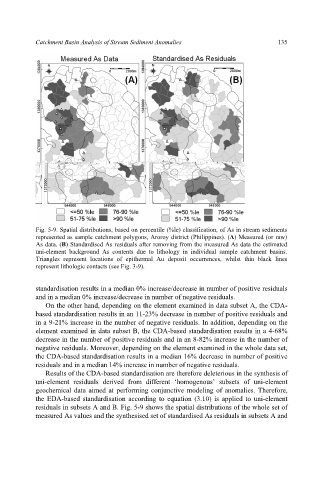
Fig. 5-9. Spatial distributions, based on percentile (%le) classification, of As in stream sediments
represented as sample catchment polygons, Aroroy district (Philippines). (A) Measured (or raw)
As data. (B) Standardised As residuals after removing from the measured As data the estimated
uni-element background As contents due to lithology in individual sample catchment basins.
Triangles represent locations of epithermal Au deposit occurrences, whilst thin black lines
represent lithologic contacts (see Fig. 3-9).
standardisation results in a median 0% increase/decrease in number of positive residuals
and in a median 0% increase/decrease in number of negative residuals.
On the other hand, depending on the element examined in data subset A, the CDA-
based standardisation results in an 11-23% decrease in number of positive residuals and
in a 9-21% increase in the number of negative residuals. In addition, depending on the
element examined in data subset B, the CDA-based standardisation results in a 4-68%
decrease in the number of positive residuals and in an 8-82% increase in the number of
negative residuals. Moreover, depending on the element examined in the whole data set,
the CDA-based standardisation results in a median 16% decrease in number of positive
residuals and in a median 14% increase in number of negative residuals.
Results of the CDA-based standardisation are therefore deleterious in the synthesis of
uni-element residuals derived from different ‘homogenous’ subsets of uni-element
geochemical data aimed at performing conjunctive modeling of anomalies. Therefore,
the EDA-based standardisation according to equation (3.10) is applied to uni-element
residuals in subsets A and B. Fig. 5-9 shows the spatial distributions of the whole set of
measured As values and the synthesised set of standardised As residuals in subsets A and