
Page 141 - Geochemical Anomaly and Mineral Prospectivity Mapping in GIS
P. 141
140 Chapter 5
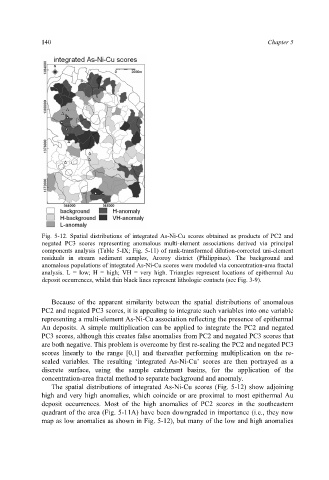
Fig. 5-12. Spatial distributions of integrated As-Ni-Cu scores obtained as products of PC2 and
negated PC3 scores representing anomalous multi-element associations derived via principal
components analysis (Table 5-IX; Fig. 5-11) of rank-transformed dilution-corrected uni-element
residuals in stream sediment samples, Aroroy district (Philippines). The background and
anomalous populations of integrated As-Ni-Cu scores were modeled via concentration-area fractal
analysis. L = low; H = high; VH = very high. Triangles represent locations of epithermal Au
deposit occurrences, whilst thin black lines represent lithologic contacts (see Fig. 3-9).
Because of the apparent similarity between the spatial distributions of anomalous
PC2 and negated PC3 scores, it is appealing to integrate such variables into one variable
representing a multi-element As-Ni-Cu association reflecting the presence of epithermal
Au deposits. A simple multiplication can be applied to integrate the PC2 and negated
PC3 scores, although this creates false anomalies from PC2 and negated PC3 scores that
are both negative. This problem is overcome by first re-scaling the PC2 and negated PC3
scores linearly to the range [0,1] and thereafter performing multiplication on the re-
scaled variables. The resulting ‘integrated As-Ni-Cu’ scores are then portrayed as a
discrete surface, using the sample catchment basins, for the application of the
concentration-area fractal method to separate background and anomaly.
The spatial distributions of integrated As-Ni-Cu scores (Fig. 5-12) show adjoining
high and very high anomalies, which coincide or are proximal to most epithermal Au
deposit occurrences. Most of the high anomalies of PC2 scores in the southeastern
quadrant of the area (Fig. 5-11A) have been downgraded in importance (i.e., they now
map as low anomalies as shown in Fig. 5-12), but many of the low and high anomalies