
Page 144 - Geochemical Anomaly and Mineral Prospectivity Mapping in GIS
P. 144
Catchment Basin Analysis of Stream Sediment Anomalies 143
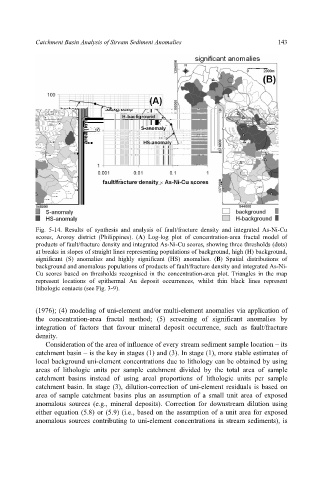
Fig. 5-14. Results of synthesis and analysis of fault/fracture density and integrated As-Ni-Cu
scores, Aroroy district (Philippines). (A) Log-log plot of concentration-area fractal model of
products of fault/fracture density and integrated As-Ni-Cu scores, showing three thresholds (dots)
at breaks in slopes of straight lines representing populations of background, high (H) background,
significant (S) anomalies and highly significant (HS) anomalies. (B) Spatial distributions of
background and anomalous populations of products of fault/fracture density and integrated As-Ni-
Cu scores based on thresholds recognised in the concentration-area plot. Triangles in the map
represent locations of epithermal Au deposit occurrences, whilst thin black lines represent
lithologic contacts (see Fig. 3-9).
(1976); (4) modeling of uni-element and/or multi-element anomalies via application of
the concentration-area fractal method; (5) screening of significant anomalies by
integration of factors that favour mineral deposit occurrence, such as fault/fracture
density.
Consideration of the area of influence of every stream sediment sample location – its
catchment basin – is the key in stages (1) and (3). In stage (1), more stable estimates of
local background uni-element concentrations due to lithology can be obtained by using
areas of lithologic units per sample catchment divided by the total area of sample
catchment basins instead of using areal proportions of lithologic units per sample
catchment basin. In stage (3), dilution-correction of uni-element residuals is based on
area of sample catchment basins plus an assumption of a small unit area of exposed
anomalous sources (e.g., mineral deposits). Correction for downstream dilution using
either equation (5.8) or (5.9) (i.e., based on the assumption of a unit area for exposed
anomalous sources contributing to uni-element concentrations in stream sediments), is