
Page 149 - Geochemical Anomaly and Mineral Prospectivity Mapping in GIS
P. 149
150 Chapter 6
TABLE 6-I
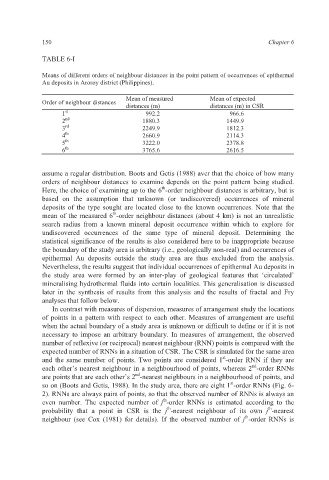
Means of different orders of neighbour distances in the point pattern of occurrences of epithermal
Au deposits in Aroroy district (Philippines).
Mean of measured Mean of expected
Order of neighbour distances
distances (m) distances (m) in CSR
1 st 992.2 966.6
2 nd 1880.3 1449.9
3 rd 2249.9 1812.3
4 th 2660.9 2114.3
5 th 3222.0 2378.8
6 th 3765.6 2616.5
assume a regular distribution. Boots and Getis (1988) aver that the choice of how many
orders of neighbour distances to examine depends on the point pattern being studied.
th
Here, the choice of examining up to the 6 -order neighbour distances is arbitrary, but is
based on the assumption that unknown (or undiscovered) occurrences of mineral
deposits of the type sought are located close to the known occurrences. Note that the
th
mean of the measured 6 -order neighbour distances (about 4 km) is not an unrealistic
search radius from a known mineral deposit occurrence within which to explore for
undiscovered occurrences of the same type of mineral deposit. Determining the
statistical significance of the results is also considered here to be inappropriate because
the boundary of the study area is arbitrary (i.e., geologically non-real) and occurrences of
epithermal Au deposits outside the study area are thus excluded from the analysis.
Nevertheless, the results suggest that individual occurrences of epithermal Au deposits in
the study area were formed by an inter-play of geological features that ‘circulated’
mineralising hydrothermal fluids into certain localities. This generalisation is discussed
later in the synthesis of results from this analysis and the results of fractal and Fry
analyses that follow below.
In contrast with measures of dispersion, measures of arrangement study the locations
of points in a pattern with respect to each other. Measures of arrangement are useful
when the actual boundary of a study area is unknown or difficult to define or if it is not
necessary to impose an arbitrary boundary. In measures of arrangement, the observed
number of reflexive (or reciprocal) nearest neighbour (RNN) points is compared with the
expected number of RNNs in a situation of CSR. The CSR is simulated for the same area
st
and the same number of points. Two points are considered 1 -order RNN if they are
nd
each other’s nearest neighbour in a neighbourhood of points, whereas 2 -order RNNs
nd
are points that are each other’s 2 -nearest neighbours in a neighbourhood of points, and
st
so on (Boots and Getis, 1988). In the study area, there are eight 1 -order RNNs (Fig. 6-
2). RNNs are always pairs of points, so that the observed number of RNNs is always an
th
even number. The expected number of j -order RNNs is estimated according to the
th
th
probability that a point in CSR is the j -nearest neighbour of its own j -nearest
th
neighbour (see Cox (1981) for details). If the observed number of j -order RNNs is