
Page 151 - Geochemical Anomaly and Mineral Prospectivity Mapping in GIS
P. 151
152 Chapter 6
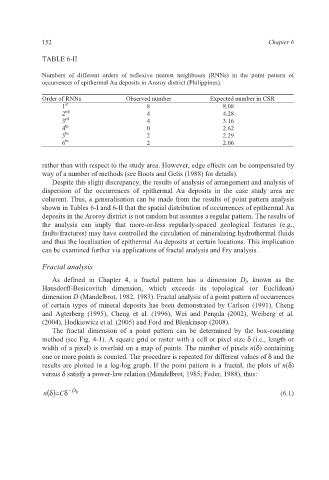
TABLE 6-II
Numbers of different orders of reflexive nearest neighbours (RNNs) in the point pattern of
occurrences of epithermal Au deposits in Aroroy district (Philippines).
Order of RNNs Observed number Expected number in CSR
1 st 8 8.08
2 nd 4 4.28
3 rd 4 3.16
4 th 0 2.62
5 th 2 2.29
6 th 2 2.06
rather than with respect to the study area. However, edge effects can be compensated by
way of a number of methods (see Boots and Getis (1988) for details).
Despite this slight discrepancy, the results of analysis of arrangement and analysis of
dispersion of the occurrences of epithermal Au deposits in the case study area are
coherent. Thus, a generalisation can be made from the results of point pattern analysis
shown in Tables 6-I and 6-II that the spatial distribution of occurrences of epithermal Au
deposits in the Aroroy district is not random but assumes a regular pattern. The results of
the analysis can imply that more-or-less regularly-spaced geological features (e.g.,
faults/fractures) may have controlled the circulation of mineralising hydrothermal fluids
and thus the localisation of epithermal Au deposits at certain locations. This implication
can be examined further via applications of fractal analysis and Fry analysis.
Fractal analysis
As defined in Chapter 4, a fractal pattern has a dimension D f, known as the
Hausdorff-Besicovitch dimension, which exceeds its topological (or Euclidean)
dimension D (Mandelbrot, 1982, 1983). Fractal analysis of a point pattern of occurrences
of certain types of mineral deposits has been demonstrated by Carlson (1991), Cheng
and Agterberg (1995), Cheng et al. (1996), Wei and Pengda (2002), Weiberg et al.
(2004), Hodkiewicz et al. (2005) and Ford and Blenkinsop (2008).
The fractal dimension of a point pattern can be determined by the box-counting
method (see Fig. 4-1). A square grid or raster with a cell or pixel size δ (i.e., length or
width of a pixel) is overlaid on a map of points. The number of pixels n(δ) containing
one or more points is counted. The procedure is repeated for different values of δ and the
results are plotted in a log-log graph. If the point pattern is a fractal, the plots of n(δ)
versus δ satisfy a power-law relation (Mandelbrot, 1985; Feder, 1988), thus:
n () Cδ=δ − D b (6.1)