
Page 156 - Geochemical Anomaly and Mineral Prospectivity Mapping in GIS
P. 156
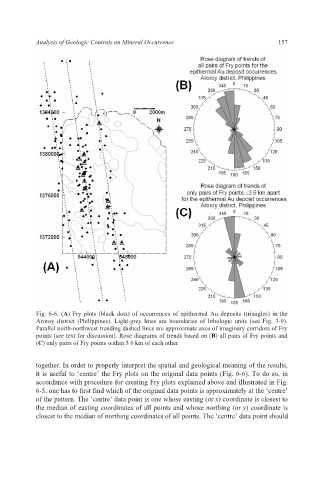
Analysis of Geologic Controls on Mineral Occurrence                  157


           Fig. 6-6. (A) Fry plots (black dots) of occurrences of epithermal Au deposits (triangles) in the
           Aroroy district  (Philippines). Light-grey lines are boundaries of lithologic units (see Fig. 3-9).
           Parallel north-northwest trending dashed lines are approximate axes of imaginary corridors of Fry
           points (see text for discussion). Rose diagrams of trends based on (B) all pairs of Fry points and
           (C) only pairs of Fry points within 3.6 km of each other.


           together. In order to properly interpret the spatial and geological meaning of the results,
           it is useful to ‘centre’ the Fry plots on the original data points (Fig. 6-6). To do so, in
           accordance with procedure for creating Fry plots explained above and illustrated in Fig.
           6-5, one has to first find which of the original data points is approximately at the ‘centre’
           of the pattern. The ‘centre’ data point is one whose easting (or x) coordinate is closest to
           the median of easting coordinates of all points and whose northing (or y) coordinate is
           closest to the median of northing coordinates of all points. The ‘centre’ data point should