
Page 155 - Geochemical Anomaly and Mineral Prospectivity Mapping in GIS
P. 155
156 Chapter 6
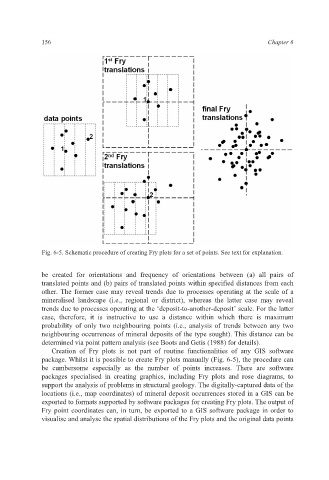
Fig. 6-5. Schematic procedure of creating Fry plots for a set of points. See text for explanation.
be created for orientations and frequency of orientations between (a) all pairs of
translated points and (b) pairs of translated points within specified distances from each
other. The former case may reveal trends due to processes operating at the scale of a
mineralised landscape (i.e., regional or district), whereas the latter case may reveal
trends due to processes operating at the ‘deposit-to-another-deposit’ scale. For the latter
case, therefore, it is instructive to use a distance within which there is maximum
probability of only two neighbouring points (i.e., analysis of trends between any two
neighbouring occurrences of mineral deposits of the type sought). This distance can be
determined via point pattern analysis (see Boots and Getis (1988) for details).
Creation of Fry plots is not part of routine functionalities of any GIS software
package. Whilst it is possible to create Fry plots manually (Fig. 6-5), the procedure can
be cumbersome especially as the number of points increases. There are software
packages specialised in creating graphics, including Fry plots and rose diagrams, to
support the analysis of problems in structural geology. The digitally-captured data of the
locations (i.e., map coordinates) of mineral deposit occurrences stored in a GIS can be
exported to formats supported by software packages for creating Fry plots. The output of
Fry point coordinates can, in turn, be exported to a GIS software package in order to
visualise and analyse the spatial distributions of the Fry plots and the original data points