
Page 152 - Geochemical Anomaly and Mineral Prospectivity Mapping in GIS
P. 152
Analysis of Geologic Controls on Mineral Occurrence 153
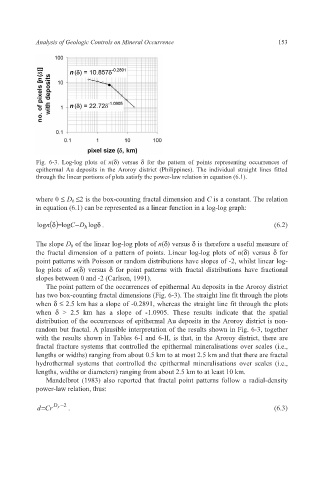
Fig. 6-3. Log-log plots of n(δ) versus δ for the pattern of points representing occurrences of
epithermal Au deposits in the Aroroy district (Philippines). The individual straight lines fitted
through the linear portions of plots satisfy the power-law relation in equation (6.1).
where 0 ≤ D b ≤2 is the box-counting fractal dimension and C is a constant. The relation
in equation (6.1) can be represented as a linear function in a log-log graph:
logn ()=δ logC −D b log δ . (6.2)
The slope D b of the linear log-log plots of n(δ) versus δ is therefore a useful measure of
the fractal dimension of a pattern of points. Linear log-log plots of n(δ) versus δ for
point patterns with Poisson or random distributions have slopes of -2, whilst linear log-
log plots of n(δ) versus δ for point patterns with fractal distributions have fractional
slopes between 0 and -2 (Carlson, 1991).
The point pattern of the occurrences of epithermal Au deposits in the Aroroy district
has two box-counting fractal dimensions (Fig. 6-3). The straight line fit through the plots
when δ ≤ 2.5 km has a slope of -0.2891, whereas the straight line fit through the plots
when δ > 2.5 km has a slope of -1.0905. These results indicate that the spatial
distribution of the occurrences of epithermal Au deposits in the Aroroy district is non-
random but fractal. A plausible interpretation of the results shown in Fig. 6-3, together
with the results shown in Tables 6-I and 6-II, is that, in the Aroroy district, there are
fractal fracture systems that controlled the epithermal mineralisations over scales (i.e.,
lengths or widths) ranging from about 0.5 km to at most 2.5 km and that there are fractal
hydrothermal systems that controlled the epithermal mineralisations over scales (i.e.,
lengths, widths or diameters) ranging from about 2.5 km to at least 10 km.
Mandelbrot (1983) also reported that fractal point patterns follow a radial-density
power-law relation, thus:
d =Cr D r − 2 . (6.3)