
Page 153 - Geochemical Anomaly and Mineral Prospectivity Mapping in GIS
P. 153
154 Chapter 6
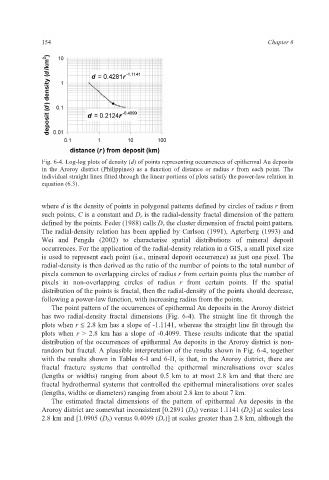
Fig. 6-4. Log-log plots of density (d) of points representing occurrences of epithermal Au deposits
in the Aroroy district (Philippines) as a function of distance or radius r from each point. The
individual straight lines fitted through the linear portions of plots satisfy the power-law relation in
equation (6.3).
where d is the density of points in polygonal patterns defined by circles of radius r from
such points, C is a constant and D r is the radial-density fractal dimension of the pattern
defined by the points. Feder (1988) calls D r the cluster dimension of fractal point pattern.
The radial-density relation has been applied by Carlson (1991), Agterberg (1993) and
Wei and Pengda (2002) to characterise spatial distributions of mineral deposit
occurrences. For the application of the radial-density relation in a GIS, a small pixel size
is used to represent each point (i.e., mineral deposit occurrence) as just one pixel. The
radial-density is then derived as the ratio of the number of points to the total number of
pixels common to overlapping circles of radius r from certain points plus the number of
pixels in non-overlapping circles of radius r from certain points. If the spatial
distribution of the points is fractal, then the radial-density of the points should decrease,
following a power-law function, with increasing radius from the points.
The point pattern of the occurrences of epithermal Au deposits in the Aroroy district
has two radial-density fractal dimensions (Fig. 6-4). The straight line fit through the
plots when r ≤ 2.8 km has a slope of -1.1141, whereas the straight line fit through the
plots when r > 2.8 km has a slope of -0.4099. These results indicate that the spatial
distribution of the occurrences of epithermal Au deposits in the Aroroy district is non-
random but fractal. A plausible interpretation of the results shown in Fig. 6-4, together
with the results shown in Tables 6-I and 6-II, is that, in the Aroroy district, there are
fractal fracture systems that controlled the epithermal mineralisations over scales
(lengths or widths) ranging from about 0.5 km to at most 2.8 km and that there are
fractal hydrothermal systems that controlled the epithermal mineralisations over scales
(lengths, widths or diameters) ranging from about 2.8 km to about 7 km.
The estimated fractal dimensions of the pattern of epithermal Au deposits in the
Aroroy district are somewhat inconsistent [0.2891 (D b) versus 1.1141 (D r)] at scales less
2.8 km and [1.0905 (D b) versus 0.4099 (D r)] at scales greater than 2.8 km, although the