
Page 139 - Geochemical Anomaly and Mineral Prospectivity Mapping in GIS
P. 139
138 Chapter 5
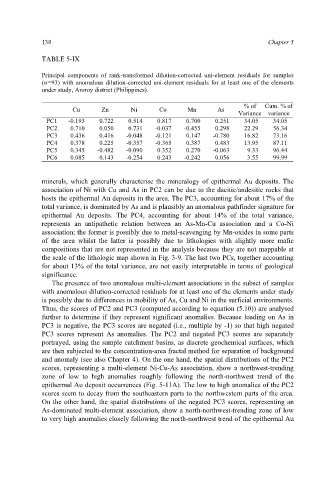
TABLE 5-IX
Principal components of rank-transformed dilution-corrected uni-element residuals for samples
(n=93) with anomalous dilution-corrected uni-element residuals for at least one of the elements
under study, Aroroy district (Philippines).
% of Cum. % of
Cu Zn Ni Co Mn As
Variance variance
PC1 -0.193 0.722 0.514 0.817 0.700 0.251 34.05 34.05
PC2 0.710 0.050 0.731 -0.037 -0.455 0.298 22.29 56.34
PC3 0.436 0.416 -0.048 -0.121 0.147 -0.780 16.82 73.16
PC4 0.378 0.225 -0.357 -0.365 0.387 0.483 13.95 87.11
PC5 0.345 -0.482 -0.090 0.352 0.270 -0.063 9.33 96.44
PC6 0.085 0.143 -0.254 0.243 -0.242 0.056 3.55 99.99
minerals, which generally characterise the mineralogy of epithermal Au deposits. The
association of Ni with Cu and As in PC2 can be due to the dacitic/andesitic rocks that
hosts the epithermal Au deposits in the area. The PC3, accounting for about 17% of the
total variance, is dominated by As and is plausibly an anomalous pathfinder signature for
epithermal Au deposits. The PC4, accounting for about 14% of the total variance,
represents an antipathetic relation between an As-Mn-Cu association and a Co-Ni
association; the former is possibly due to metal-scavenging by Mn-oxides in some parts
of the area whilst the latter is possibly due to lithologies with slightly more mafic
compositions that are not represented in the analysis because they are not mappable at
the scale of the lithologic map shown in Fig. 3-9. The last two PCs, together accounting
for about 13% of the total variance, are not easily interpretable in terms of geological
significance.
The presence of two anomalous multi-element associations in the subset of samples
with anomalous dilution-corrected residuals for at least one of the elements under study
is possibly due to differences in mobility of As, Cu and Ni in the surficial environments.
Thus, the scores of PC2 and PC3 (computed according to equation (5.10)) are analysed
further to determine if they represent significant anomalies. Because loading on As in
PC3 is negative, the PC3 scores are negated (i.e., multiple by -1) so that high negated
PC3 scores represent As anomalies. The PC2 and negated PC3 scores are separately
portrayed, using the sample catchment basins, as discrete geochemical surfaces, which
are then subjected to the concentration-area fractal method for separation of background
and anomaly (see also Chapter 4). On the one hand, the spatial distributions of the PC2
scores, representing a multi-element Ni-Cu-As association, show a northwest-trending
zone of low to high anomalies roughly following the north-northwest trend of the
epithermal Au deposit occurrences (Fig. 5-11A). The low to high anomalies of the PC2
scores seem to decay from the southeastern parts to the northwestern parts of the area.
On the other hand, the spatial distributions of the negated PC3 scores, representing an
As-dominated multi-element association, show a north-northwest-trending zone of low
to very high anomalies closely following the north-northwest trend of the epithermal Au