
Page 140 - Geochemical Anomaly and Mineral Prospectivity Mapping in GIS
P. 140
Catchment Basin Analysis of Stream Sediment Anomalies 139
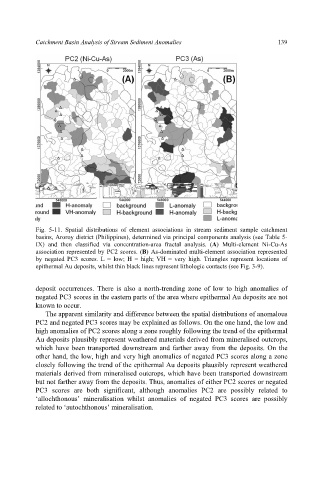
Fig. 5-11. Spatial distributions of element associations in stream sediment sample catchment
basins, Aroroy district (Philippines), determined via principal components analysis (see Table 5-
IX) and then classified via concentration-area fractal analysis. (A) Multi-element Ni-Cu-As
association represented by PC2 scores. (B) As-dominated multi-element association represented
by negated PC3 scores. L = low; H = high; VH = very high. Triangles represent locations of
epithermal Au deposits, whilst thin black lines represent lithologic contacts (see Fig. 3-9).
deposit occurrences. There is also a north-trending zone of low to high anomalies of
negated PC3 scores in the eastern parts of the area where epithermal Au deposits are not
known to occur.
The apparent similarity and difference between the spatial distributions of anomalous
PC2 and negated PC3 scores may be explained as follows. On the one hand, the low and
high anomalies of PC2 scores along a zone roughly following the trend of the epithermal
Au deposits plausibly represent weathered materials derived from mineralised outcrops,
which have been transported downstream and farther away from the deposits. On the
other hand, the low, high and very high anomalies of negated PC3 scores along a zone
closely following the trend of the epithermal Au deposits plausibly represent weathered
materials derived from mineralised outcrops, which have been transported downstream
but not farther away from the deposits. Thus, anomalies of either PC2 scores or negated
PC3 scores are both significant, although anomalies PC2 are possibly related to
‘allochthonous’ mineralisation whilst anomalies of negated PC3 scores are possibly
related to ‘autochthonous’ mineralisation.