
Page 133 - Geochemical Anomaly and Mineral Prospectivity Mapping in GIS
P. 133
132 Chapter 5
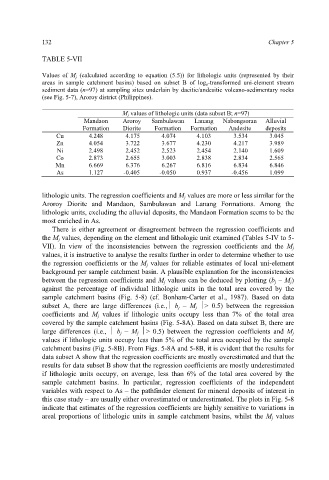
TABLE 5-VII
Values of M j (calculated according to equation (5.5)) for lithologic units (represented by their
areas in sample catchment basins) based on subset B of log e -transformed uni-element stream
sediment data (n=97) at sampling sites underlain by dacitic/andesitic volcano-sedimentary rocks
(see Fig. 5-7), Aroroy district (Philippines).
M j values of lithologic units (data subset B; n=97)
Mandaon Aroroy Sambulawan Lanang Nabongsoran Alluvial
Formation Diorite Formation Formation Andesite deposits
Cu 4.248 4.175 4.074 4.103 3.534 3.045
Zn 4.054 3.722 3.677 4.230 4.217 3.989
Ni 2.498 2.452 2.523 2.454 2.140 1.609
Co 2.873 2.655 3.003 2.838 2.834 2.565
Mn 6.669 6.376 6.267 6.816 6.834 6.846
As 1.127 -0.405 -0.050 0.937 -0.456 1.099
lithologic units. The regression coefficients and M j values are more or less similar for the
Aroroy Diorite and Mandaon, Sambulawan and Lanang Formations. Among the
lithologic units, excluding the alluvial deposits, the Mandaon Formation seems to be the
most enriched in As.
There is either agreement or disagreement between the regression coefficients and
the M j values, depending on the element and lithologic unit examined (Tables 5-IV to 5-
VII). In view of the inconsistencies between the regression coefficients and the M j
values, it is instructive to analyse the results further in order to determine whether to use
the regression coefficients or the M j values for reliable estimates of local uni-element
background per sample catchment basin. A plausible explanation for the inconsistencies
between the regression coefficients and M j values can be deduced by plotting (b j – M j)
against the percentage of individual lithologic units in the total area covered by the
sample catchment basins (Fig. 5-8) (cf. Bonham-Carter et al., 1987). Based on data
subset A, there are large differences (i.e.,⏐ b j – M j ⏐> 0.5) between the regression
coefficients and M j values if lithologic units occupy less than 7% of the total area
covered by the sample catchment basins (Fig. 5-8A). Based on data subset B, there are
large differences (i.e., ⏐ b j – M j ⏐> 0.5) between the regression coefficients and M j
values if lithologic units occupy less than 5% of the total area occupied by the sample
catchment basins (Fig. 5-8B). From Figs. 5-8A and 5-8B, it is evident that the results for
data subset A show that the regression coefficients are mostly overestimated and that the
results for data subset B show that the regression coefficients are mostly underestimated
if lithologic units occupy, on average, less than 6% of the total area covered by the
sample catchment basins. In particular, regression coefficients of the independent
variables with respect to As – the pathfinder element for mineral deposits of interest in
this case study – are usually either overestimated or underestimated. The plots in Fig. 5-8
indicate that estimates of the regression coefficients are highly sensitive to variations in
areal proportions of lithologic units in sample catchment basins, whilst the M j values