
Page 125 - Geochemical Anomaly and Mineral Prospectivity Mapping in GIS
P. 125
124 Chapter 5
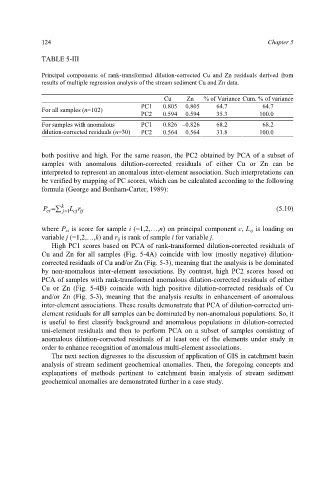
TABLE 5-III
Principal components of rank-transformed dilution-corrected Cu and Zn residuals derived from
results of multiple regression analysis of the stream sediment Cu and Zn data.
Cu Zn % of Variance Cum. % of variance
PC1 0.805 0.805 64.7 64.7
For all samples (n=102)
PC2 –0.594 0.594 35.3 100.0
For samples with anomalous PC1 0.826 –0.826 68.2 68.2
dilution-corrected residuals (n=30) PC2 0.564 0.564 31.8 100.0
both positive and high. For the same reason, the PC2 obtained by PCA of a subset of
samples with anomalous dilution-corrected residuals of either Cu or Zn can be
interpreted to represent an anomalous inter-element association. Such interpretations can
be verified by mapping of PC scores, which can be calculated according to the following
formula (George and Bonham-Carter, 1989):
k
P ci = ¦ = j 1 L cj r ij (5.10)
where P ci is score for sample i (=1,2,…,n) on principal component c, L cj is loading on
variable j (=1,2,…,k) and r ij is rank of sample i for variable j.
High PC1 scores based on PCA of rank-transformed dilution-corrected residuals of
Cu and Zn for all samples (Fig. 5-4A) coincide with low (mostly negative) dilution-
corrected residuals of Cu and/or Zn (Fig. 5-3), meaning that the analysis is be dominated
by non-anomalous inter-element associations. By contrast, high PC2 scores based on
PCA of samples with rank-transformed anomalous dilution-corrected residuals of either
Cu or Zn (Fig. 5-4B) coincide with high positive dilution-corrected residuals of Cu
and/or Zn (Fig. 5-3), meaning that the analysis results in enhancement of anomalous
inter-element associations. These results demonstrate that PCA of dilution-corrected uni-
element residuals for all samples can be dominated by non-anomalous populations. So, it
is useful to first classify background and anomalous populations in dilution-corrected
uni-element residuals and then to perform PCA on a subset of samples consisting of
anomalous dilution-corrected residuals of at least one of the elements under study in
order to enhance recognition of anomalous multi-element associations.
The next section digresses to the discussion of application of GIS in catchment basin
analysis of stream sediment geochemical anomalies. Then, the foregoing concepts and
explanations of methods pertinent to catchment basin analysis of stream sediment
geochemical anomalies are demonstrated further in a case study.