
Page 112 - Geochemical Anomaly and Mineral Prospectivity Mapping in GIS
P. 112
Fractal Analysis of Geochemical Anomalies 111
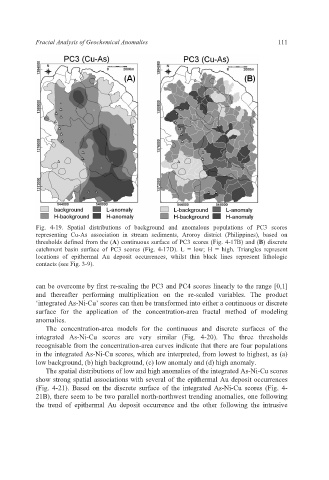
Fig. 4-19. Spatial distributions of background and anomalous populations of PC3 scores
representing Cu-As association in stream sediments, Aroroy district (Philippines), based on
thresholds defined from the (A) continuous surface of PC3 scores (Fig. 4-17B) and (B) discrete
catchment basin surface of PC3 scores (Fig. 4-17D). L = low; H = high. Triangles represent
locations of epithermal Au deposit occurrences, whilst thin black lines represent lithologic
contacts (see Fig. 3-9).
can be overcome by first re-scaling the PC3 and PC4 scores linearly to the range [0,1]
and thereafter performing multiplication on the re-scaled variables. The product
‘integrated As-Ni-Cu’ scores can then be transformed into either a continuous or discrete
surface for the application of the concentration-area fractal method of modeling
anomalies.
The concentration-area models for the continuous and discrete surfaces of the
integrated As-Ni-Cu scores are very similar (Fig. 4-20). The three thresholds
recognisable from the concentration-area curves indicate that there are four populations
in the integrated As-Ni-Cu scores, which are interpreted, from lowest to highest, as (a)
low background, (b) high background, (c) low anomaly and (d) high anomaly.
The spatial distributions of low and high anomalies of the integrated As-Ni-Cu scores
show strong spatial associations with several of the epithermal Au deposit occurrences
(Fig. 4-21). Based on the discrete surface of the integrated As-Ni-Cu scores (Fig. 4-
21B), there seem to be two parallel north-northwest trending anomalies, one following
the trend of epithermal Au deposit occurrence and the other following the intrusive