
Page 108 - Geochemical Anomaly and Mineral Prospectivity Mapping in GIS
P. 108
Fractal Analysis of Geochemical Anomalies 107
Analysis and mapping of anomalous multi-element signature
As in Chapter 3, principal components analysis (PCA) is applied to the geochemical
data prior to the generation of continuous and discrete geochemical surfaces to be used
in the concentration-area fractal analysis of multi-element anomalies. Cheng et al. (1997)
have also applied PCA to surficial sediment (till, soil and humus) geochemical data prior
to creation of geochemical contour maps used in the concentration-area fractal analysis
of multi-element anomalies. To apply PCA here, the uni-element data are log e-
transformed so that they approach approximately symmetrical empirical density
distributions. Because ‘complete’ catchment basin surfaces of the data are desired for
comparison with continuous geochemical surfaces, censored values for As are not
excluded in the analysis. Table 4-II shows the derived principal components (PCs),
which are similar to those obtained in Chapter 3 (see Tables 3-VII and 3-VIII). The PC3
(Cu-As) and PC4 (As-Ni) obtained here (Table 4-II) are somewhat similar to the
anomalous multi-element associations represented by PC2 (Cu-As-Ni) and PC3 (As)
shown in Table 3-VIII.
The PC3 and the PC4 obtained in the analysis here can be interpreted as follows. The
Cu-As association represented by PC3 plausibly reflects presence of mineralisation in
the area because these elements are usually enriched in sulphide (chalcopyritic and
arsenopyrtic) minerals, which generally characterise the mineralogy of epithermal Au
deposits. The As-Ni association represented by PC4 also plausibly reflects presence of
mineralisation because As is a pathfinder for many types of hydrothermal gold deposits
and Ni is probably related to dacitic/andesitic rocks that hosts the epithermal Au deposits
in the area. Thus, both PC3 and PC4 represent multi-element associations reflecting
presence of epithermal Au deposits in the area.
The slight difference in proportion of the total variance of the stream sediment uni-
element data explained by PC3 and PC4 (Table 4-II) provides insight into which of the
multi-element associations they represent is slightly more important than the other in
terms of indicating presence of epithermal Au deposits. The slightly higher proportion of
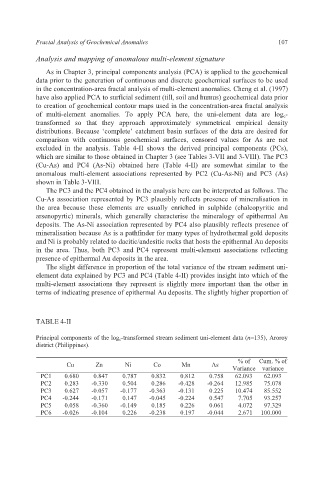
TABLE 4-II
Principal components of the log e -transformed stream sediment uni-element data (n=135), Aroroy
district (Philippines).
% of Cum. % of
Cu Zn Ni Co Mn As
Variance variance
PC1 0.680 0.847 0.787 0.832 0.812 0.758 62.093 62.093
PC2 0.283 -0.330 0.504 0.286 -0.428 -0.264 12.985 75.078
PC3 0.627 -0.057 -0.177 -0.363 -0.131 0.225 10.474 85.552
PC4 -0.244 -0.171 0.147 -0.045 -0.224 0.547 7.705 93.257
PC5 0.058 -0.360 -0.149 0.185 0.226 0.061 4.072 97.329
PC6 -0.026 -0.104 0.226 -0.238 0.197 -0.044 2.671 100.000