
Page 106 - Geochemical Anomaly and Mineral Prospectivity Mapping in GIS
P. 106
Fractal Analysis of Geochemical Anomalies 105
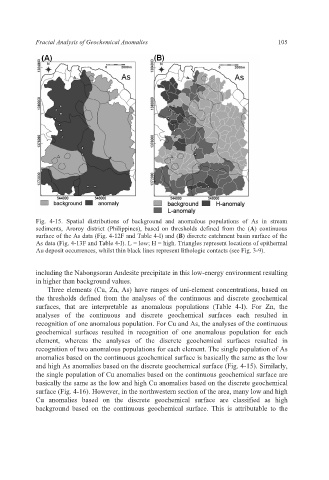
Fig. 4-15. Spatial distributions of background and anomalous populations of As in stream
sediments, Aroroy district (Philippines), based on thresholds defined from the (A) continuous
surface of the As data (Fig. 4-12F and Table 4-I) and (B) discrete catchment basin surface of the
As data (Fig. 4-13F and Table 4-I). L = low; H = high. Triangles represent locations of epithermal
Au deposit occurrences, whilst thin black lines represent lithologic contacts (see Fig. 3-9).
including the Nabongsoran Andesite precipitate in this low-energy environment resulting
in higher than background values.
Three elements (Cu, Zn, As) have ranges of uni-element concentrations, based on
the thresholds defined from the analyses of the continuous and discrete geochemical
surfaces, that are interpretable as anomalous populations (Table 4-I). For Zn, the
analyses of the continuous and discrete geochemical surfaces each resulted in
recognition of one anomalous population. For Cu and As, the analyses of the continuous
geochemical surfaces resulted in recognition of one anomalous population for each
element, whereas the analyses of the discrete geochemical surfaces resulted in
recognition of two anomalous populations for each element. The single population of As
anomalies based on the continuous geochemical surface is basically the same as the low
and high As anomalies based on the discrete geochemical surface (Fig. 4-15). Similarly,
the single population of Cu anomalies based on the continuous geochemical surface are
basically the same as the low and high Cu anomalies based on the discrete geochemical
surface (Fig. 4-16). However, in the northwestern section of the area, many low and high
Cu anomalies based on the discrete geochemical surface are classified as high
background based on the continuous geochemical surface. This is attributable to the