
Page 103 - Geochemical Anomaly and Mineral Prospectivity Mapping in GIS
P. 103
102 Chapter 4
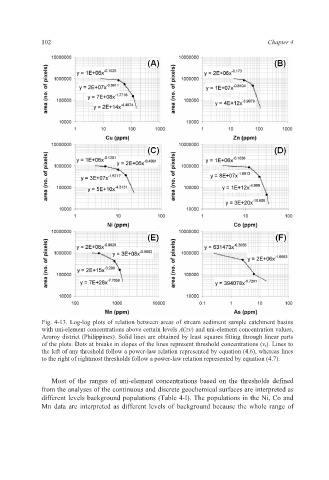
Fig. 4-13. Log-log plots of relation between areas of stream sediment sample catchment basins
with uni-element concentrations above certain levels A(v) and uni-element concentration values,
Aroroy district (Philippines). Solid lines are obtained by least squares fitting through linear parts
of the plots. Dots at breaks in slopes of the lines represent threshold concentrations (v t ). Lines to
the left of any threshold follow a power-law relation represented by equation (4.6), whereas lines
to the right of rightmost thresholds follow a power-law relation represented by equation (4.7).
Most of the ranges of uni-element concentrations based on the thresholds defined
from the analyses of the continuous and discrete geochemical surfaces are interpreted as
different levels background populations (Table 4-I). The populations in the Ni, Co and
Mn data are interpreted as different levels of background because the whole range of