
Page 104 - Geochemical Anomaly and Mineral Prospectivity Mapping in GIS
P. 104
Fractal Analysis of Geochemical Anomalies 103
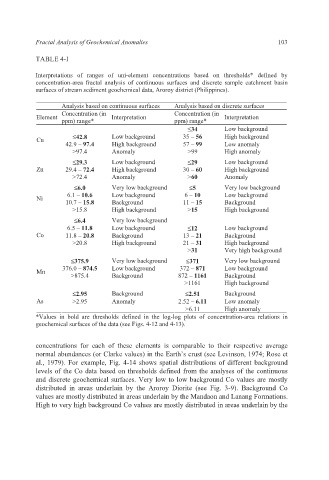
TABLE 4-I
Interpretations of ranges of uni-element concentrations based on thresholds* defined by
concentration-area fractal analysis of continuous surfaces and discrete sample catchment basin
surfaces of stream sediment geochemical data, Aroroy district (Philippines).
Analysis based on continuous surfaces Analysis based on discrete surfaces
Concentration (in Concentration (in
Element Interpretation Interpretation
ppm) range* ppm) range*
≤34 Low background
Cu ≤42.8 Low background 35 – 56 High background
42.9 – 97.4 High background 57 – 99 Low anomaly
>97.4 Anomaly >99 High anomaly
≤29.3 Low background ≤29 Low background
Zn 29.4 – 72.4 High background 30 – 60 High background
>72.4 Anomaly >60 Anomaly
≤6.0 Very low background ≤5 Very low background
6.1 – 10.6 Low background 6 – 10 Low background
Ni
10.7 – 15.8 Background 11 – 15 Background
>15.8 High background >15 High background
≤6.4 Very low background
6.5 – 11.8 Low background ≤12 Low background
Co 11.8 – 20.8 Background 13 – 21 Background
>20.8 High background 21 – 31 High background
>31 Very high background
≤375.9 Very low background ≤371 Very low background
Mn 376.0 – 874.5 Low background 372 – 871 Low background
>875.4 Background 872 – 1161 Background
>1161 High background
≤2.95 Background ≤2.51 Background
As >2.95 Anomaly 2.52 – 6.11 Low anomaly
>6.11 High anomaly
*Values in bold are thresholds defined in the log-log plots of concentration-area relations in
geochemical surfaces of the data (see Figs. 4-12 and 4-13).
concentrations for each of these elements is comparable to their respective average
normal abundances (or Clarke values) in the Earth’s crust (see Levinson, 1974; Rose et
al., 1979). For example, Fig. 4-14 shows spatial distributions of different background
levels of the Co data based on thresholds defined from the analyses of the continuous
and discrete geochemical surfaces. Very low to low background Co values are mostly
distributed in areas underlain by the Aroroy Diorite (see Fig. 3-9). Background Co
values are mostly distributed in areas underlain by the Mandaon and Lanang Formations.
High to very high background Co values are mostly distributed in areas underlain by the