
Page 102 - Geochemical Anomaly and Mineral Prospectivity Mapping in GIS
P. 102
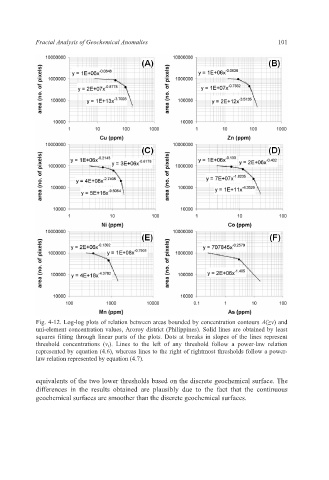
Fractal Analysis of Geochemical Anomalies 101
Fig. 4-12. Log-log plots of relation between areas bounded by concentration contours A(v) and
uni-element concentration values, Aroroy district (Philippines). Solid lines are obtained by least
squares fitting through linear parts of the plots. Dots at breaks in slopes of the lines represent
threshold concentrations (v t ). Lines to the left of any threshold follow a power-law relation
represented by equation (4.6), whereas lines to the right of rightmost thresholds follow a power-
law relation represented by equation (4.7).
equivalents of the two lower thresholds based on the discrete geochemical surface. The
differences in the results obtained are plausibly due to the fact that the continuous
geochemical surfaces are smoother than the discrete geochemical surfaces.