
Page 98 - Geochemical Anomaly and Mineral Prospectivity Mapping in GIS
P. 98
Fractal Analysis of Geochemical Anomalies 97
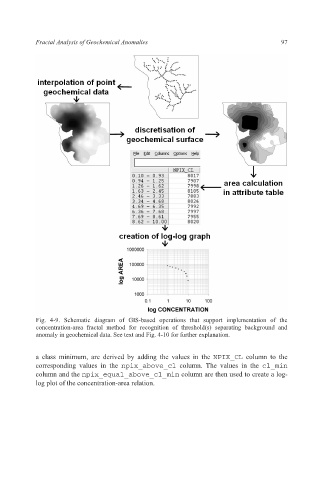
Fig. 4-9. Schematic diagram of GIS-based operations that support implementation of the
concentration-area fractal method for recognition of threshold(s) separating background and
anomaly in geochemical data. See text and Fig. 4-10 for further explanation.
a class minimum, are derived by adding the values in the NPIX_CL column to the
corresponding values in the npix_above_cl column. The values in the cl_min
column and the npix_equal_above_cl_min column are then used to create a log-
log plot of the concentration-area relation.