
Page 96 - Geochemical Anomaly and Mineral Prospectivity Mapping in GIS
P. 96
Fractal Analysis of Geochemical Anomalies 95
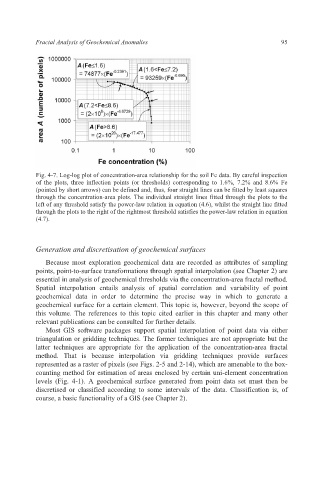
Fig. 4-7. Log-log plot of concentration-area relationship for the soil Fe data. By careful inspection
of the plots, three inflection points (or thresholds) corresponding to 1.6%, 7.2% and 8.6% Fe
(pointed by short arrows) can be defined and, thus, four straight lines can be fitted by least squares
through the concentration-area plots. The individual straight lines fitted through the plots to the
left of any threshold satisfy the power-law relation in equation (4.6), whilst the straight line fitted
through the plots to the right of the rightmost threshold satisfies the power-law relation in equation
(4.7).
Generation and discretisation of geochemical surfaces
Because most exploration geochemical data are recorded as attributes of sampling
points, point-to-surface transformations through spatial interpolation (see Chapter 2) are
essential in analysis of geochemical thresholds via the concentration-area fractal method.
Spatial interpolation entails analysis of spatial correlation and variability of point
geochemical data in order to determine the precise way in which to generate a
geochemical surface for a certain element. This topic is, however, beyond the scope of
this volume. The references to this topic cited earlier in this chapter and many other
relevant publications can be consulted for further details.
Most GIS software packages support spatial interpolation of point data via either
triangulation or gridding techniques. The former techniques are not appropriate but the
latter techniques are appropriate for the application of the concentration-area fractal
method. That is because interpolation via gridding techniques provide surfaces
represented as a raster of pixels (see Figs. 2-5 and 2-14), which are amenable to the box-
counting method for estimation of areas enclosed by certain uni-element concentration
levels (Fig. 4-1). A geochemical surface generated from point data set must then be
discretised or classified according to some intervals of the data. Classification is, of
course, a basic functionality of a GIS (see Chapter 2).