
Page 91 - Geochemical Anomaly and Mineral Prospectivity Mapping in GIS
P. 91
90 Chapter 4
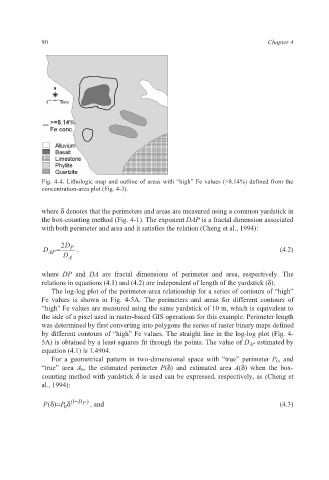
Fig. 4-4. Lithologic map and outline of areas with “high” Fe values (>8.14%) defined from the
concentration-area plot (Fig. 4-3).
where δ denotes that the perimeters and areas are measured using a common yardstick in
the box-counting method (Fig. 4-1). The exponent DAP is a fractal dimension associated
with both perimeter and area and it satisfies the relation (Cheng et al., 1994):
2 D
D = P . (4.2)
AP
D A
where DP and DA are fractal dimensions of perimeter and area, respectively. The
relations in equations (4.1) and (4.2) are independent of length of the yardstick (δ).
The log-log plot of the perimeter-area relationship for a series of contours of “high”
Fe values is shown in Fig. 4-5A. The perimeters and areas for different contours of
“high” Fe values are measured using the same yardstick of 10 m, which is equivalent to
the side of a pixel used in raster-based GIS operations for this example. Perimeter length
was determined by first converting into polygons the series of raster binary maps defined
by different contours of “high” Fe values. The straight line in the log-log plot (Fig. 4-
5A) is obtained by a least squares fit through the points. The value of D AP estimated by
equation (4.1) is 1.4904.
For a geometrical pattern in two-dimensional space with “true” perimeter P 0, and
“true” area A 0, the estimated perimeter P(δ) and estimated area A(δ) when the box-
counting method with yardstick δ is used can be expressed, respectively, as (Cheng et
al., 1994):
−
( P δ ) P δ 1 ( D P ) , and (4.3)
=
0