
Page 90 - Geochemical Anomaly and Mineral Prospectivity Mapping in GIS
P. 90
Fractal Analysis of Geochemical Anomalies 89
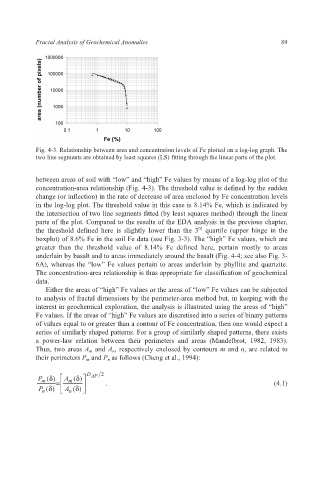
Fig. 4-3. Relationship between area and concentration levels of Fe plotted on a log-log graph. The
two line segments are obtained by least squares (LS) fitting through the linear parts of the plot.
between areas of soil with “low” and “high” Fe values by means of a log-log plot of the
concentration-area relationship (Fig. 4-3). The threshold value is defined by the sudden
change (or inflection) in the rate of decrease of area enclosed by Fe concentration levels
in the log-log plot. The threshold value in this case is 8.14% Fe, which is indicated by
the intersection of two line segments fitted (by least squares method) through the linear
parts of the plot. Compared to the results of the EDA analysis in the previous chapter,
rd
the threshold defined here is slightly lower than the 3 quartile (upper hinge in the
boxplot) of 8.6% Fe in the soil Fe data (see Fig. 3-3). The “high” Fe values, which are
greater than the threshold value of 8.14% Fe defined here, pertain mostly to areas
underlain by basalt and to areas immediately around the basalt (Fig. 4-4; see also Fig. 3-
6A), whereas the “low” Fe values pertain to areas underlain by phyllite and quartzite.
The concentration-area relationship is thus appropriate for classification of geochemical
data.
Either the areas of “high” Fe values or the areas of “low” Fe values can be subjected
to analysis of fractal dimensions by the perimeter-area method but, in keeping with the
interest in geochemical exploration, the analysis is illustrated using the areas of “high”
Fe values. If the areas of “high” Fe values are discretised into a series of binary patterns
of values equal to or greater than a contour of Fe concentration, then one would expect a
series of similarly shaped patterns. For a group of similarly shaped patterns, there exists
a power-law relation between their perimeters and areas (Mandelbrot, 1982, 1983).
Thus, two areas A m and A n, respectively enclosed by contours m and n, are related to
their perimeters P m and P n as follows (Cheng et al., 1994):
P m (δ ) ª A m (δ ) º D AP 2 . (4.1)
=
P n (δ ) « ¬ A n (δ ) » ¼