
Page 89 - Geochemical Anomaly and Mineral Prospectivity Mapping in GIS
P. 89
88 Chapter 4
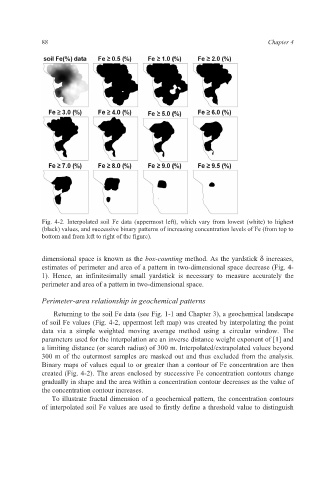
Fig. 4-2. Interpolated soil Fe data (uppermost left), which vary from lowest (white) to highest
(black) values, and successive binary patterns of increasing concentration levels of Fe (from top to
bottom and from left to right of the figure).
dimensional space is known as the box-counting method. As the yardstick δ increases,
estimates of perimeter and area of a pattern in two-dimensional space decrease (Fig. 4-
1). Hence, an infinitesimally small yardstick is necessary to measure accurately the
perimeter and area of a pattern in two-dimensional space.
Perimeter-area relationship in geochemical patterns
Returning to the soil Fe data (see Fig. 1-1 and Chapter 3), a geochemical landscape
of soil Fe values (Fig. 4-2, uppermost left map) was created by interpolating the point
data via a simple weighted moving average method using a circular window. The
parameters used for the interpolation are an inverse distance weight exponent of [1] and
a limiting distance (or search radius) of 300 m. Interpolated/extrapolated values beyond
300 m of the outermost samples are masked out and thus excluded from the analysis.
Binary maps of values equal to or greater than a contour of Fe concentration are then
created (Fig. 4-2). The areas enclosed by successive Fe concentration contours change
gradually in shape and the area within a concentration contour decreases as the value of
the concentration contour increases.
To illustrate fractal dimension of a geochemical pattern, the concentration contours
of interpolated soil Fe values are used to firstly define a threshold value to distinguish