
Page 88 - Geochemical Anomaly and Mineral Prospectivity Mapping in GIS
P. 88
Fractal Analysis of Geochemical Anomalies 87
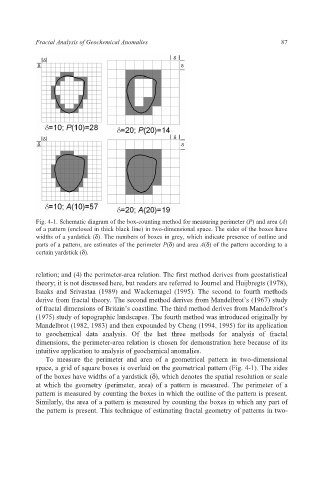
Fig. 4-1. Schematic diagram of the box-counting method for measuring perimeter (P) and area (A)
of a pattern (enclosed in thick black line) in two-dimensional space. The sides of the boxes have
widths of a yardstick (δ). The numbers of boxes in grey, which indicate presence of outline and
parts of a pattern, are estimates of the perimeter P(δ) and area A(δ) of the pattern according to a
certain yardstick (δ).
relation; and (4) the perimeter-area relation. The first method derives from geostatistical
theory; it is not discussed here, but readers are referred to Journel and Huijbregts (1978),
Isaaks and Srivastaa (1989) and Wackernagel (1995). The second to fourth methods
derive from fractal theory. The second method derives from Mandelbrot’s (1967) study
of fractal dimensions of Britain’s coastline. The third method derives from Mandelbrot’s
(1975) study of topographic landscapes. The fourth method was introduced originally by
Mandelbrot (1982, 1983) and then expounded by Cheng (1994, 1995) for its application
to geochemical data analysis. Of the last three methods for analysis of fractal
dimensions, the perimeter-area relation is chosen for demonstration here because of its
intuitive application to analysis of geochemical anomalies.
To measure the perimeter and area of a geometrical pattern in two-dimensional
space, a grid of square boxes is overlaid on the geometrical pattern (Fig. 4-1). The sides
of the boxes have widths of a yardstick (δ), which denotes the spatial resolution or scale
at which the geometry (perimeter, area) of a pattern is measured. The perimeter of a
pattern is measured by counting the boxes in which the outline of the pattern is present.
Similarly, the area of a pattern is measured by counting the boxes in which any part of
the pattern is present. This technique of estimating fractal geometry of patterns in two-