
Page 92 - Geochemical Anomaly and Mineral Prospectivity Mapping in GIS
P. 92
Fractal Analysis of Geochemical Anomalies 91
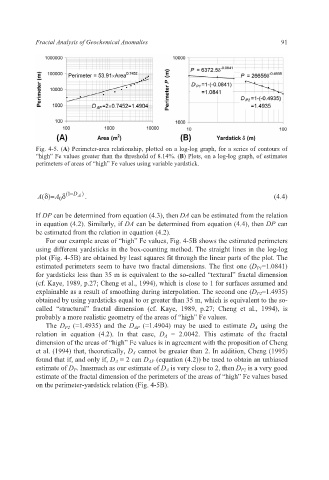
Fig. 4-5. (A) Perimeter-area relationship, plotted on a log-log graph, for a series of contours of
“high” Fe values greater than the threshold of 8.14%. (B) Plots, on a log-log graph, of estimates
perimeters of areas of “high” Fe values using variable yardstick.
−
=
( A δ ) A δ 1 ( D A ) . (4.4)
0
If DP can be determined from equation (4.3), then DA can be estimated from the relation
in equation (4.2). Similarly, if DA can be determined from equation (4.4), then DP can
be estimated from the relation in equation (4.2).
For our example areas of “high” Fe values, Fig. 4-5B shows the estimated perimeters
using different yardsticks in the box-counting method. The straight lines in the log-log
plot (Fig. 4-5B) are obtained by least squares fit through the linear parts of the plot. The
estimated perimeters seem to have two fractal dimensions. The first one (D P1=1.0841)
for yardsticks less than 35 m is equivalent to the so-called “textural” fractal dimension
(cf. Kaye, 1989, p.27; Cheng et al., 1994), which is close to 1 for surfaces assumed and
explainable as a result of smoothing during interpolation. The second one (D P2=1.4935)
obtained by using yardsticks equal to or greater than 35 m, which is equivalent to the so-
called “structural” fractal dimension (cf. Kaye, 1989, p.27; Cheng et al., 1994), is
probably a more realistic geometry of the areas of “high” Fe values.
The D P2 (=1.4935) and the D AP (=1.4904) may be used to estimate D A using the
relation in equation (4.2). In that case, D A = 2.0042. This estimate of the fractal
dimension of the areas of “high” Fe values is in agreement with the proposition of Cheng
et al. (1994) that, theoretically, D A cannot be greater than 2. In addition, Cheng (1995)
found that if, and only if, D A = 2 can D AP (equation (4.2)) be used to obtain an unbiased
estimate of D P. Inasmuch as our estimate of D A is very close to 2, then D P2 is a very good
estimate of the fractal dimension of the perimeters of the areas of “high” Fe values based
on the perimeter-yardstick relation (Fig. 4-5B).