
Page 97 - Geochemical Anomaly and Mineral Prospectivity Mapping in GIS
P. 97
96 Chapter 4
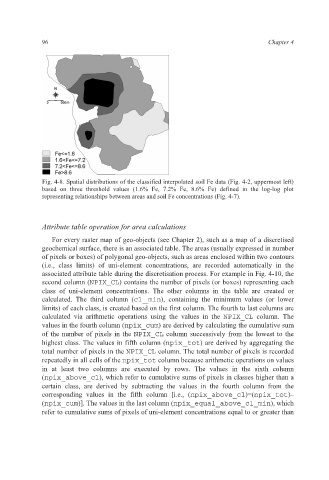
Fig. 4-8. Spatial distributions of the classified interpolated soil Fe data (Fig. 4-2, uppermost left)
based on three threshold values (1.6% Fe, 7.2% Fe, 8.6% Fe) defined in the log-log plot
representing relationships between areas and soil Fe concentrations (Fig. 4-7).
Attribute table operation for area calculations
For every raster map of geo-objects (see Chapter 2), such as a map of a discretised
geochemical surface, there is an associated table. The areas (usually expressed in number
of pixels or boxes) of polygonal geo-objects, such as areas enclosed within two contours
(i.e., class limits) of uni-element concentrations, are recorded automatically in the
associated attribute table during the discretisation process. For example in Fig. 4-10, the
second column (NPIX_CL) contains the number of pixels (or boxes) representing each
class of uni-element concentrations. The other columns in the table are created or
calculated. The third column (cl min), containing the minimum values (or lower
limits) of each class, is created based on the first column. The fourth to last columns are
calculated via arithmetic operations using the values in the NPIX_CL column. The
values in the fourth column (npix cum) are derived by calculating the cumulative sum
of the number of pixels in the NPIX_CL column successively from the lowest to the
highest class. The values in fifth column (npix tot) are derived by aggregating the
total number of pixels in the NPIX_CL column. The total number of pixels is recorded
repeatedly in all cells of the npix_tot column because arithmetic operations on values
in at least two columns are executed by rows. The values in the sixth column
(npix_above_cl), which refer to cumulative sums of pixels in classes higher than a
certain class, are derived by subtracting the values in the fourth column from the
corresponding values in the fifth column [i.e., (npix_above_cl)=(npix_tot)–
(npix cum)]. The values in the last column (npix_equal_above_cl_min), which
refer to cumulative sums of pixels of uni-element concentrations equal to or greater than