
Page 83 - Geochemical Anomaly and Mineral Prospectivity Mapping in GIS
P. 83
82 Chapter 3
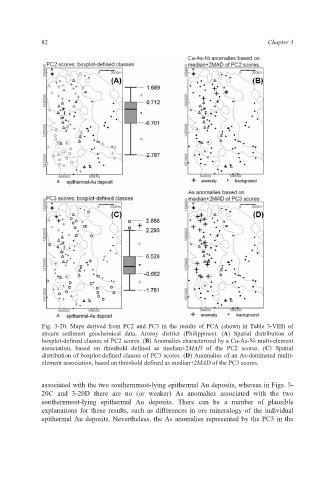
Fig. 3-20. Maps derived from PC2 and PC3 in the results of PCA (shown in Table 3-VIII) of
stream sediment geochemical data, Aroroy district (Philippines). (A) Spatial distribution of
boxplot-defined classes of PC2 scores. (B) Anomalies characterised by a Cu-As-Ni multi-element
association, based on threshold defined as median+2MAD of the PC2 scores. (C) Spatial
distribution of boxplot-defined classes of PC3 scores. (D) Anomalies of an As-dominated multi-
element association, based on threshold defined as median+2MAD of the PC3 scores.
associated with the two southernmost-lying epithermal Au deposits, whereas in Figs. 3-
20C and 3-20D there are no (or weaker) As anomalies associated with the two
southernmost-lying epithermal Au deposits. There can be a number of plausible
explanations for these results, such as differences in ore mineralogy of the individual
epithermal Au deposits. Nevertheless, the As anomalies represented by the PC3 in the