
Page 81 - Geochemical Anomaly and Mineral Prospectivity Mapping in GIS
P. 81
80 Chapter 3
TABLE 3-VII
Principal components of the log e -transformed uni-element data sets (Aroroy district, Philippines)
exclusive of samples with censored As values (n=95) and standardised according to equation
(3.11).
% of Cum. % of
Cu Zn Ni Co Mn As
Variance variance
PC1 0.601 0.803 0.834 0.849 0.793 0.663 58.167 58.167
PC2 0.670 -0.346 0.304 -0.071 -0.473 0.085 14.942 73.109
PC3 -0.099 -0.083 -0.139 -0.295 0.008 0.733 11.011 84.120
PC4 0.405 0.293 -0.326 -0.327 0.180 -0.107 8.446 92.566
PC5 0.124 -0.367 -0.203 0.184 0.288 -0.181 5.133 97.699
PC6 0.032 0.095 -0.212 0.215 -0.181 0.063 2.301 100.000
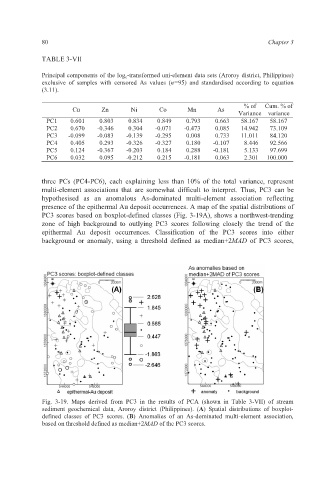
three PCs (PC4-PC6), each explaining less than 10% of the total variance, represent
multi-element associations that are somewhat difficult to interpret. Thus, PC3 can be
hypothesised as an anomalous As-dominated multi-element association reflecting
presence of the epithermal Au deposit occurrences. A map of the spatial distributions of
PC3 scores based on boxplot-defined classes (Fig. 3-19A), shows a northwest-trending
zone of high background to outlying PC3 scores following closely the trend of the
epithermal Au deposit occurrences. Classification of the PC3 scores into either
background or anomaly, using a threshold defined as median+2MAD of PC3 scores,
Fig. 3-19. Maps derived from PC3 in the results of PCA (shown in Table 3-VII) of stream
sediment geochemical data, Aroroy district (Philippines). (A) Spatial distributions of boxplot-
defined classes of PC3 scores. (B) Anomalies of an As-dominated multi-element association,
based on threshold defined as median+2MAD of the PC3 scores.