
Page 77 - Geochemical Anomaly and Mineral Prospectivity Mapping in GIS
P. 77
76 Chapter 3
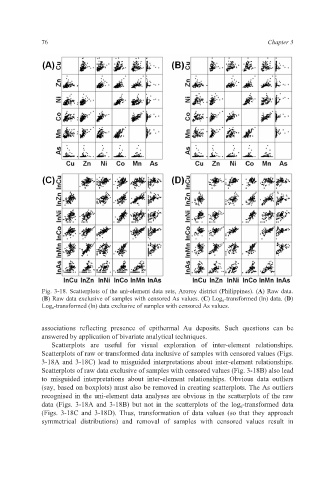
Fig. 3-18. Scatterplots of the uni-element data sets, Aroroy district (Philippines). (A) Raw data.
(B) Raw data exclusive of samples with censored As values. (C) Log e -transformed (ln) data. (D)
Log e -transformed (ln) data exclusive of samples with censored As values.
associations reflecting presence of epithermal Au deposits. Such questions can be
answered by application of bivariate analytical techniques.
Scatterplots are useful for visual exploration of inter-element relationships.
Scatterplots of raw or transformed data inclusive of samples with censored values (Figs.
3-18A and 3-18C) lead to misguided interpretations about inter-element relationships.
Scatterplots of raw data exclusive of samples with censored values (Fig. 3-18B) also lead
to misguided interpretations about inter-element relationships. Obvious data outliers
(say, based on boxplots) must also be removed in creating scatterplots. The As outliers
recognised in the uni-element data analyses are obvious in the scatterplots of the raw
data (Figs. 3-18A and 3-18B) but not in the scatterplots of the log e-transformed data
(Figs. 3-18C and 3-18D). Thus, transformation of data values (so that they approach
symmetrical distributions) and removal of samples with censored values result in