
Page 74 - Geochemical Anomaly and Mineral Prospectivity Mapping in GIS
P. 74
Exploratory Analysis of Geochemical Anomalies 73
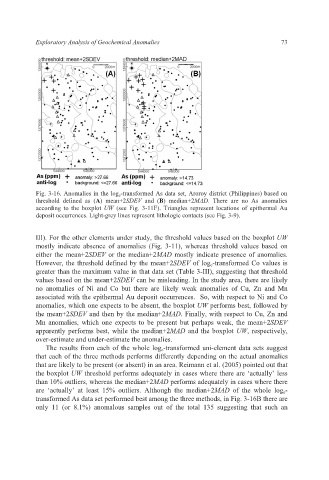
Fig. 3-16. Anomalies in the log e -transformed As data set, Aroroy district (Philippines) based on
threshold defined as (A) mean+2SDEV and (B) median+2MAD. There are no As anomalies
according to the boxplot UW (see Fig. 3-11F). Triangles represent locations of epithermal Au
deposit occurrences. Light-grey lines represent lithologic contacts (see Fig. 3-9).
III). For the other elements under study, the threshold values based on the boxplot UW
mostly indicate absence of anomalies (Fig. 3-11), whereas threshold values based on
either the mean+2SDEV or the median+2MAD mostly indicate presence of anomalies.
However, the threshold defined by the mean+2SDEV of log e-transformed Co values is
greater than the maximum value in that data set (Table 3-III), suggesting that threshold
values based on the mean+2SDEV can be misleading. In the study area, there are likely
no anomalies of Ni and Co but there are likely weak anomalies of Cu, Zn and Mn
associated with the epithermal Au deposit occurrences. So, with respect to Ni and Co
anomalies, which one expects to be absent, the boxplot UW performs best, followed by
the mean+2SDEV and then by the median+2MAD. Finally, with respect to Cu, Zn and
Mn anomalies, which one expects to be present but perhaps weak, the mean+2SDEV
apparently performs best, while the median+2MAD and the boxplot UW, respectively,
over-estimate and under-estimate the anomalies.
The results from each of the whole log e-transformed uni-element data sets suggest
that each of the three methods performs differently depending on the actual anomalies
that are likely to be present (or absent) in an area. Reimann et al. (2005) pointed out that
the boxplot UW threshold performs adequately in cases where there are ‘actually’ less
than 10% outliers, whereas the median+2MAD performs adequately in cases where there
are ‘actually’ at least 15% outliers. Although the median+2MAD of the whole log e-
transformed As data set performed best among the three methods, in Fig. 3-16B there are
only 11 (or 8.1%) anomalous samples out of the total 135 suggesting that such an