
Page 70 - Geochemical Anomaly and Mineral Prospectivity Mapping in GIS
P. 70
Exploratory Analysis of Geochemical Anomalies 69
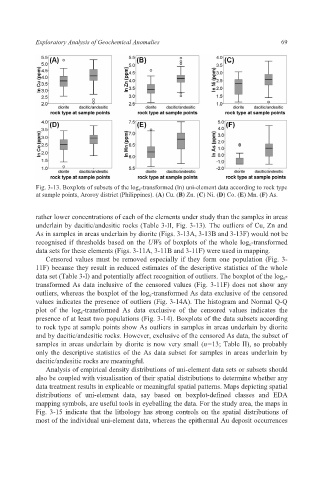
Fig. 3-13. Boxplots of subsets of the log e -transformed (ln) uni-element data according to rock type
at sample points, Aroroy district (Philippines). (A) Cu. (B) Zn. (C) Ni. (D) Co. (E) Mn. (F) As.
rather lower concentrations of each of the elements under study than the samples in areas
underlain by dacitic/andesitic rocks (Table 3-II, Fig. 3-13). The outliers of Cu, Zn and
As in samples in areas underlain by diorite (Figs. 3-13A, 3-13B and 3-13F) would not be
recognised if thresholds based on the UWs of boxplots of the whole log e-transformed
data sets for these elements (Figs. 3-11A, 3-11B and 3-11F) were used in mapping.
Censored values must be removed especially if they form one population (Fig. 3-
11F) because they result in reduced estimates of the descriptive statistics of the whole
data set (Table 3-I) and potentially affect recognition of outliers. The boxplot of the log e-
transformed As data inclusive of the censored values (Fig. 3-11F) does not show any
outliers, whereas the boxplot of the log e-transformed As data exclusive of the censored
values indicates the presence of outliers (Fig. 3-14A). The histogram and Normal Q-Q
plot of the log e-transformed As data exclusive of the censored values indicates the
presence of at least two populations (Fig. 3-14). Boxplots of the data subsets according
to rock type at sample points show As outliers in samples in areas underlain by diorite
and by dacitic/andesitic rocks. However, exclusive of the censored As data, the subset of
samples in areas underlain by diorite is now very small (n=13; Table II), so probably
only the descriptive statistics of the As data subset for samples in areas underlain by
dacitic/andesitic rocks are meaningful.
Analysis of empirical density distributions of uni-element data sets or subsets should
also be coupled with visualisation of their spatial distributions to determine whether any
data treatment results in explicable or meaningful spatial patterns. Maps depicting spatial
distributions of uni-element data, say based on boxplot-defined classes and EDA
mapping symbols, are useful tools in eyeballing the data. For the study area, the maps in
Fig. 3-15 indicate that the lithology has strong controls on the spatial distributions of
most of the individual uni-element data, whereas the epithermal Au deposit occurrences