
Page 67 - Geochemical Anomaly and Mineral Prospectivity Mapping in GIS
P. 67
66 Chapter 3
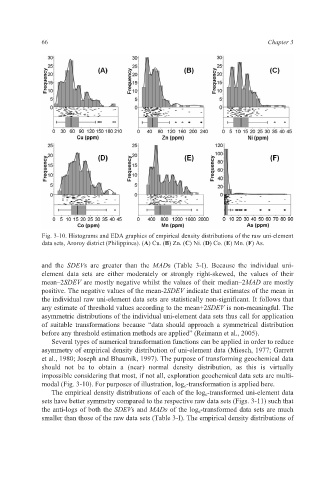
Fig. 3-10. Histograms and EDA graphics of empirical density distributions of the raw uni-element
data sets, Aroroy district (Philippines). (A) Cu. (B) Zn. (C) Ni. (D) Co. (E) Mn. (F) As.
and the SDEVs are greater than the MADs (Table 3-I). Because the individual uni-
element data sets are either moderately or strongly right-skewed, the values of their
mean–2SDEV are mostly negative whilst the values of their median–2MAD are mostly
positive. The negative values of the mean-2SDEV indicate that estimates of the mean in
the individual raw uni-element data sets are statistically non-significant. It follows that
any estimate of threshold values according to the mean+2SDEV is non-meaningful. The
asymmetric distributions of the individual uni-element data sets thus call for application
of suitable transformations because “data should approach a symmetrical distribution
before any threshold estimation methods are applied” (Reimann et al., 2005).
Several types of numerical transformation functions can be applied in order to reduce
asymmetry of empirical density distribution of uni-element data (Miesch, 1977; Garrett
et al., 1980; Joseph and Bhaumik, 1997). The purpose of transforming geochemical data
should not be to obtain a (near) normal density distribution, as this is virtually
impossible considering that most, if not all, exploration geochemical data sets are multi-
modal (Fig. 3-10). For purposes of illustration, log e-transformation is applied here.
The empirical density distributions of each of the log e-transformed uni-element data
sets have better symmetry compared to the respective raw data sets (Figs. 3-11) such that
the anti-logs of both the SDEVs and MADs of the log e-transformed data sets are much
smaller than those of the raw data sets (Table 3-I). The empirical density distributions of